Case studies


How We Replaced Four Research Processes with One (in six weeks, with one person)
Five AI agents and one dashboard turned a week of manual market research into a 93-minute monthly run. Inside the Flexi IT system — and how we set it up for clients.

Like most service companies, we conducted marketing research in several stages: collecting job posts from Upwork, reviewing competitors' websites, and analyzing recent posts on Twitter and other social media platforms. We grouped all this information into a spreadsheet and discussed it during team calls.
We wanted to understand current market dynamics and identify what people actually needed. Based on these insights, we developed our marketing and sales campaigns. Since our company is actively integrating AI into its processes, we wanted to automate a workflow we had previously handled manually. Below, we'll share what we built and the results we achieved.
Impact
- 6 weeks build time with one person. A traditional team would have estimated 2-3 months.
- 93 minutes per month for the full monthly run
- 5 minutes per insight from a fresh signal to an email sequence ready in Snov.io.
- 5 agents running in parallel covering Upwork, Reddit, web research, competitors, and supplementary trends.
What problem were we trying to solve?
Our team struggled to see the big picture. When many people are involved in discussions, everyone interprets information differently. We were looking at the same data but reaching different conclusions.
As a result, we lacked alignment on sales campaigns and content planning.
The problem had a structural cause. We did not have a centralized place to store market data. We also lacked a system for tracking historical market data.
First, we documented the manual process each person followed individually.
Then we started thinking about improvements. We discussed what we could add and what had previously been impossible because we did not have enough time.
As we continued brainstorming, we came up with ideas that had previously been impossible to implement because manual research consumed too much time.
How we built it
Development started next. With just one person and Claude Code, we completed the project in six weeks. Traditional team-based development, which we had used before, would have required two to three months of active work. The design was also created in-house using Claude Code. Architecture, integrations, and validation evolved within one live workflow. Development and design happened simultaneously instead of being handed off between separate roles. After experimenting with this approach on our own project, we began implementing it for client projects as well. As a result, development and design timelines have been reduced by 2-3x.
Inside the system
Upwork
We process every new posting from the previous month, group them by service category, and separate the US, UK, and AU markets. We also track month-over-month changes. Sales teams can spot demand shifts before competitors do.
We monitor 15 subreddits: 10 general business communities such as small business, sales, automation, no-code, and entrepreneurs, plus 5 industry verticals including legal, HR, real estate, property management, and health and fitness. Only the top posts of the month are included. Low-value one-sentence comments are filtered out.
Web research
Each run includes one deep research query plus 7-8 targeted searches. We only use verifiable platforms such as Clutch, G2, Gartner, Statista, Accounting Today, Law.com, and Inman. We exclude paywalled websites like TechCrunch, VentureBeat, LinkedIn, and Medium. Every cited number can be verified directly.
Competitor monitoring
We analyze more than 30 AI agencies each month, including over 15 direct competitors and several larger benchmark companies. We review four pages on each website: products, pricing, case studies, and blog content. New offers, pricing changes, and positioning shifts are automatically flagged. Pricing changes are detected within the same week instead of the same quarter.
Supplementary trends
This layer captures signals the other four sources miss, including technology shifts, regulatory changes, and emerging approaches. We continuously add new queries based on patterns discovered in earlier runs. Seasonal noise, such as quarterly earnings spikes during the first week of the quarter, is detected and discounted automatically. This helps separate real market shifts from cyclical spikes.
How it looks in action
The screens below come from the production version of the system the Flexi IT team uses every day.
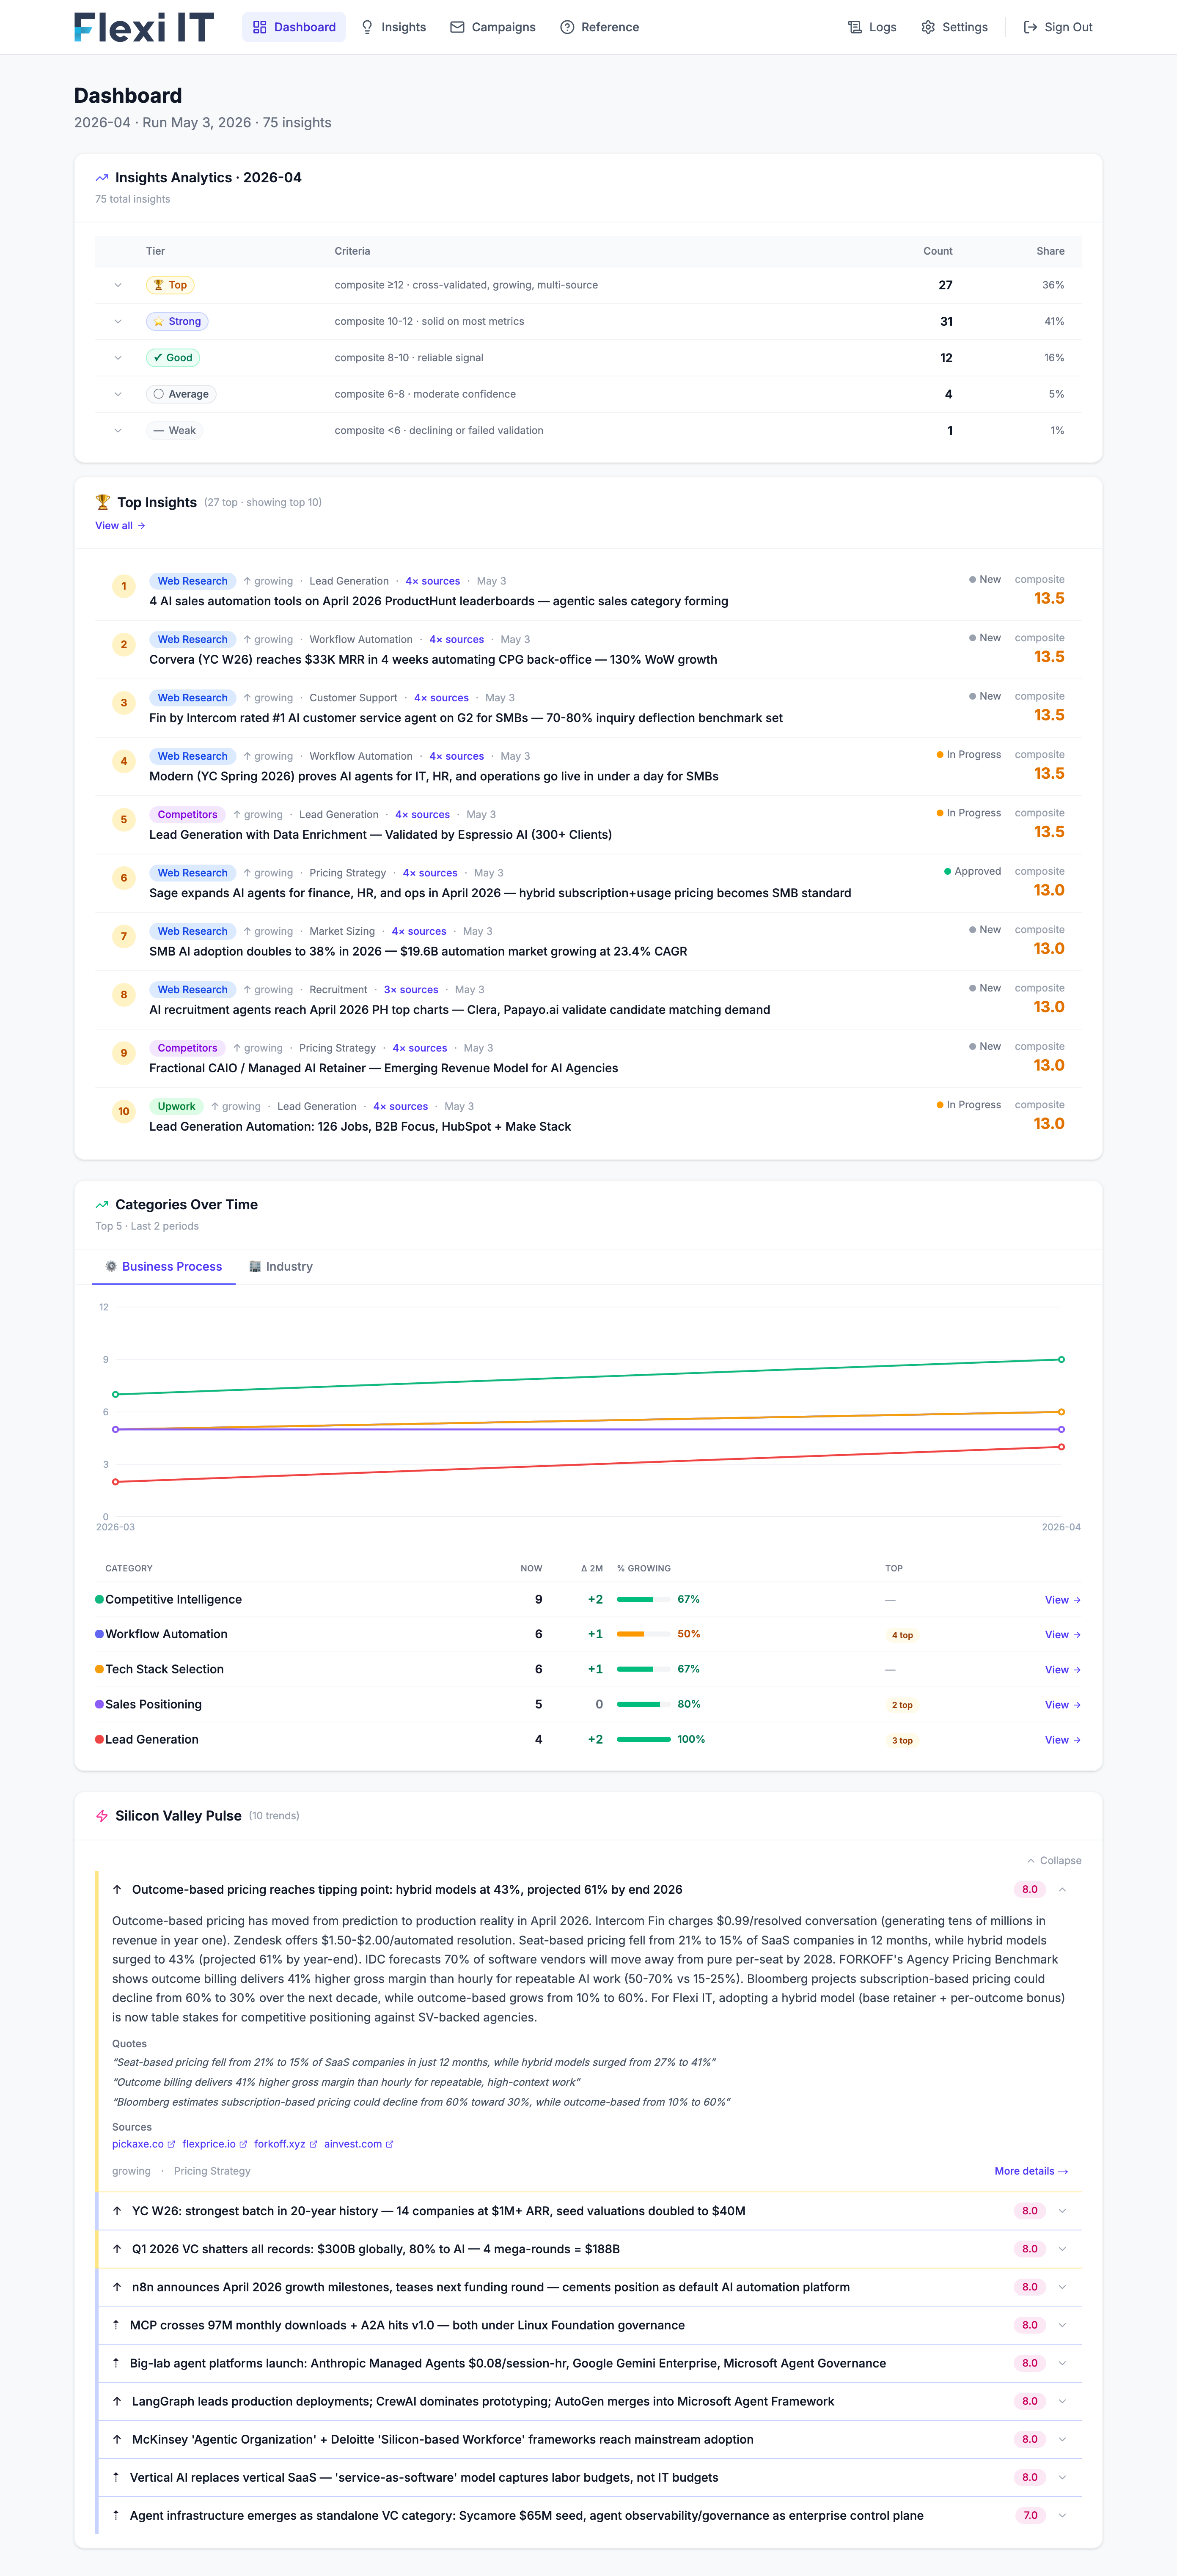
The main screen gives a high-level view of the market: top insights, sorted by trust level and by what changed since the last run, plus quick access to the workflow.
Dashboard and search
The main screen gives a high-level view of the market: top insights, sorted by trust level and by what changed since the last run, plus quick access to the workflow.
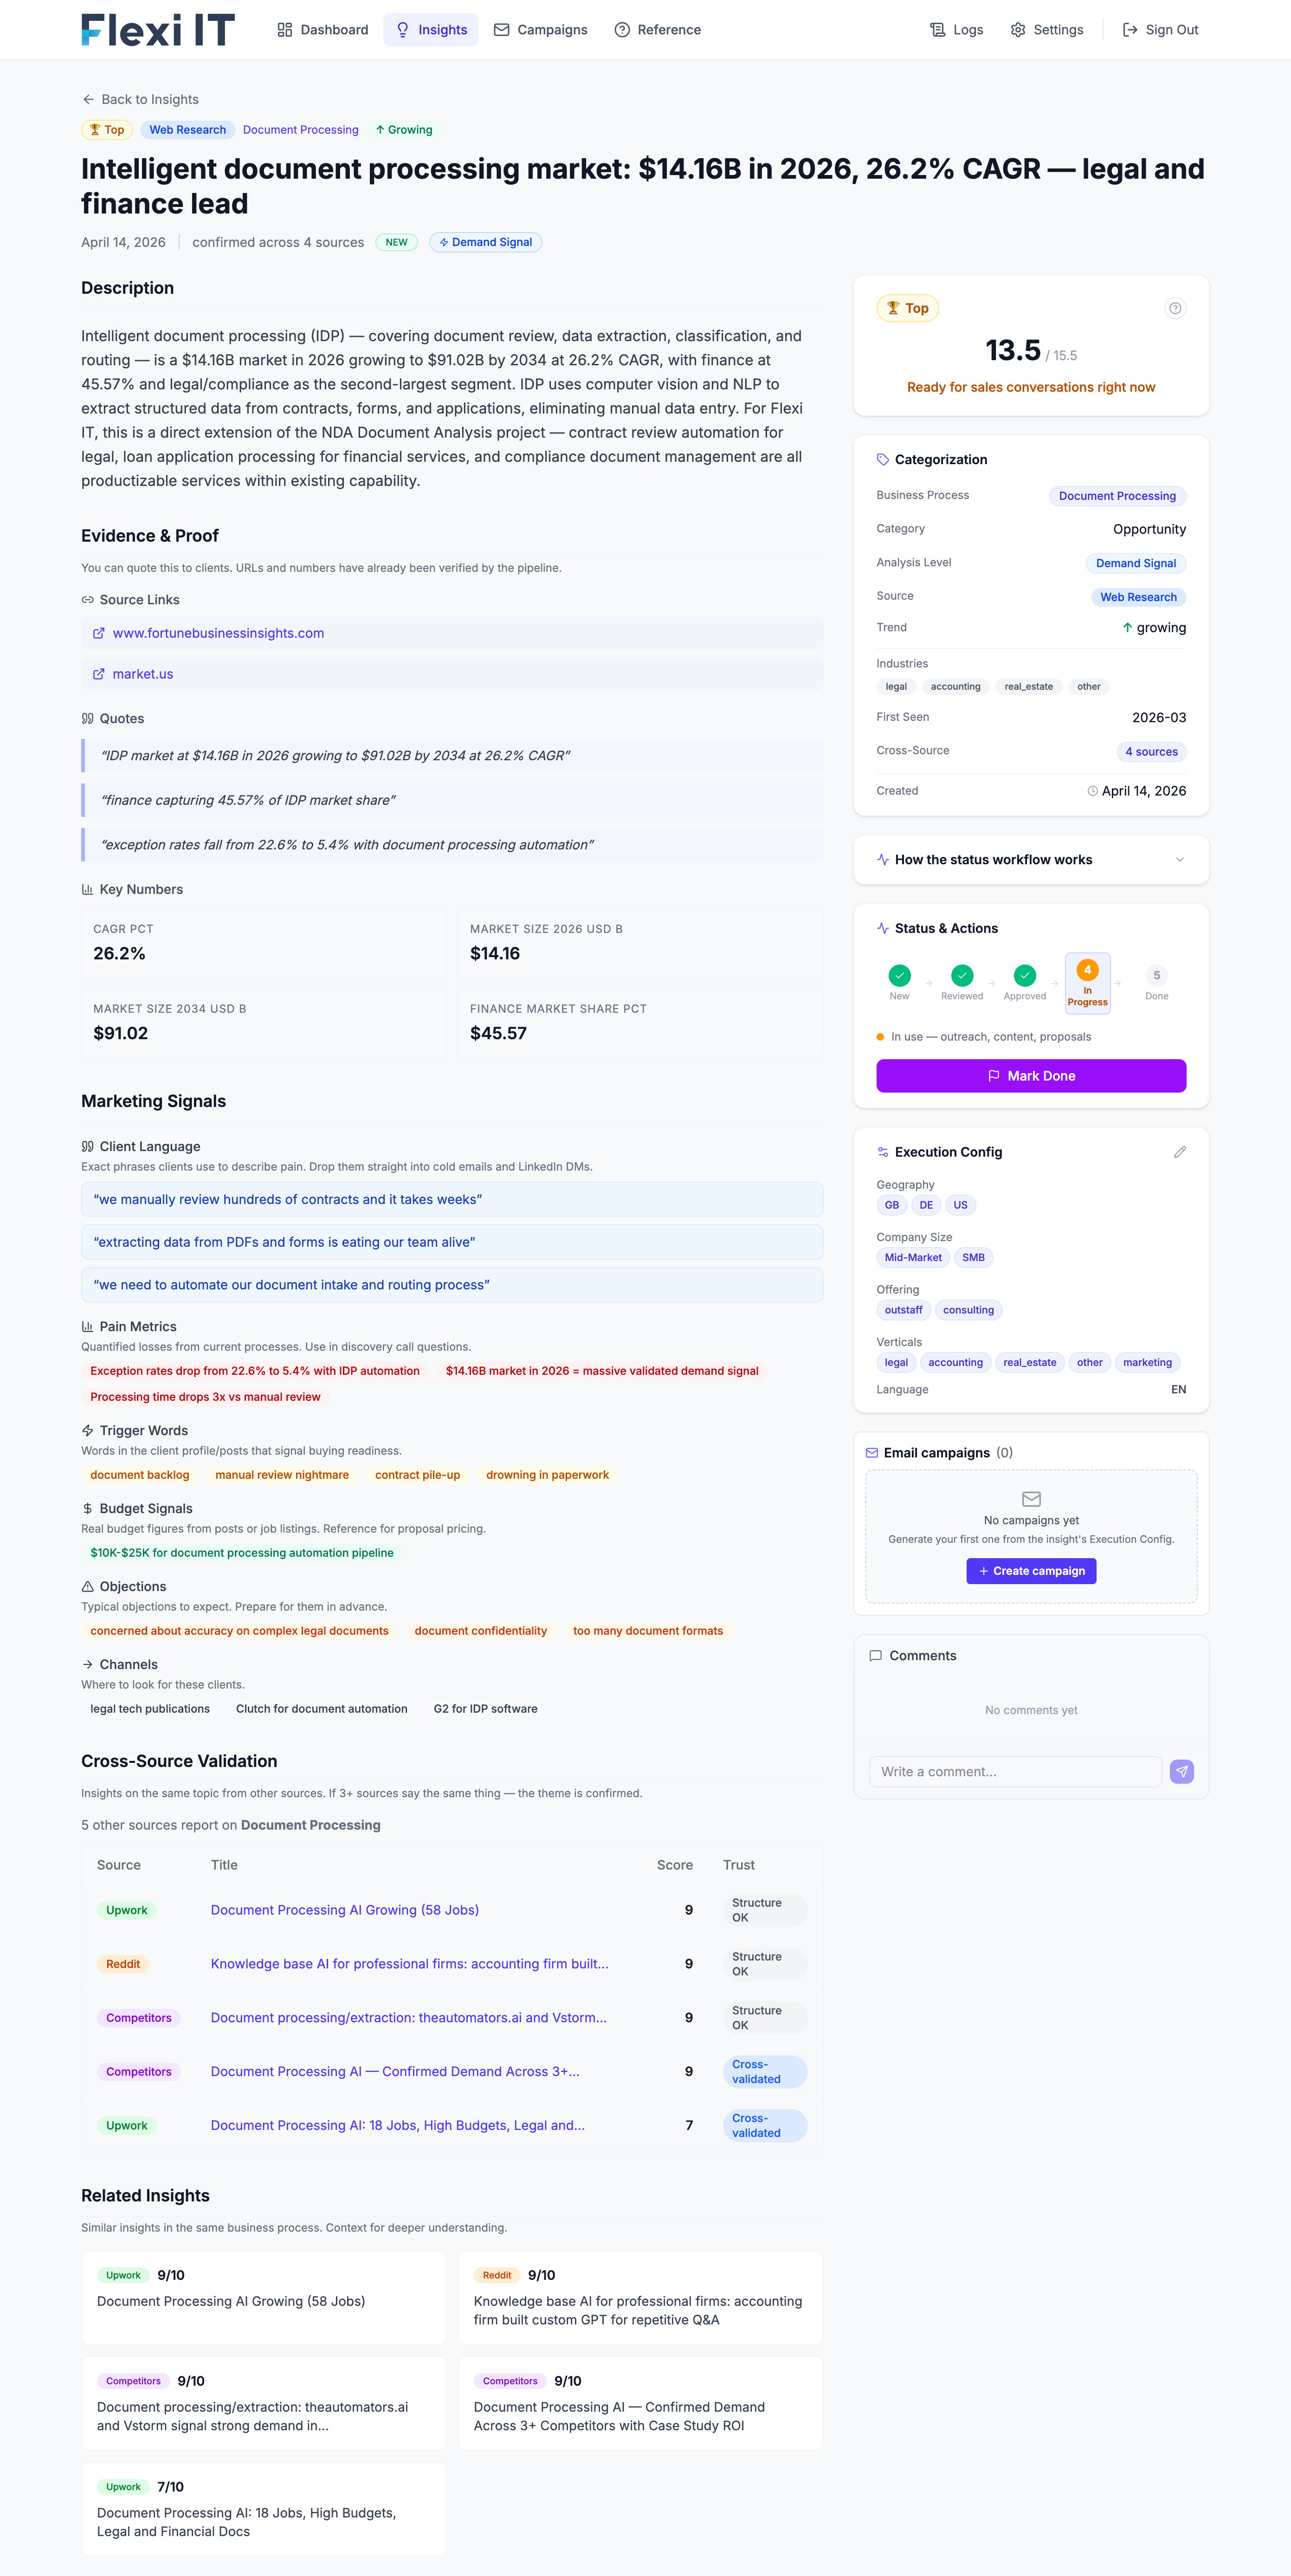
Each insight has its own detail view: an importance score, the trust level, which sources it came from, what we recommend doing about it, and a history of changes between runs.
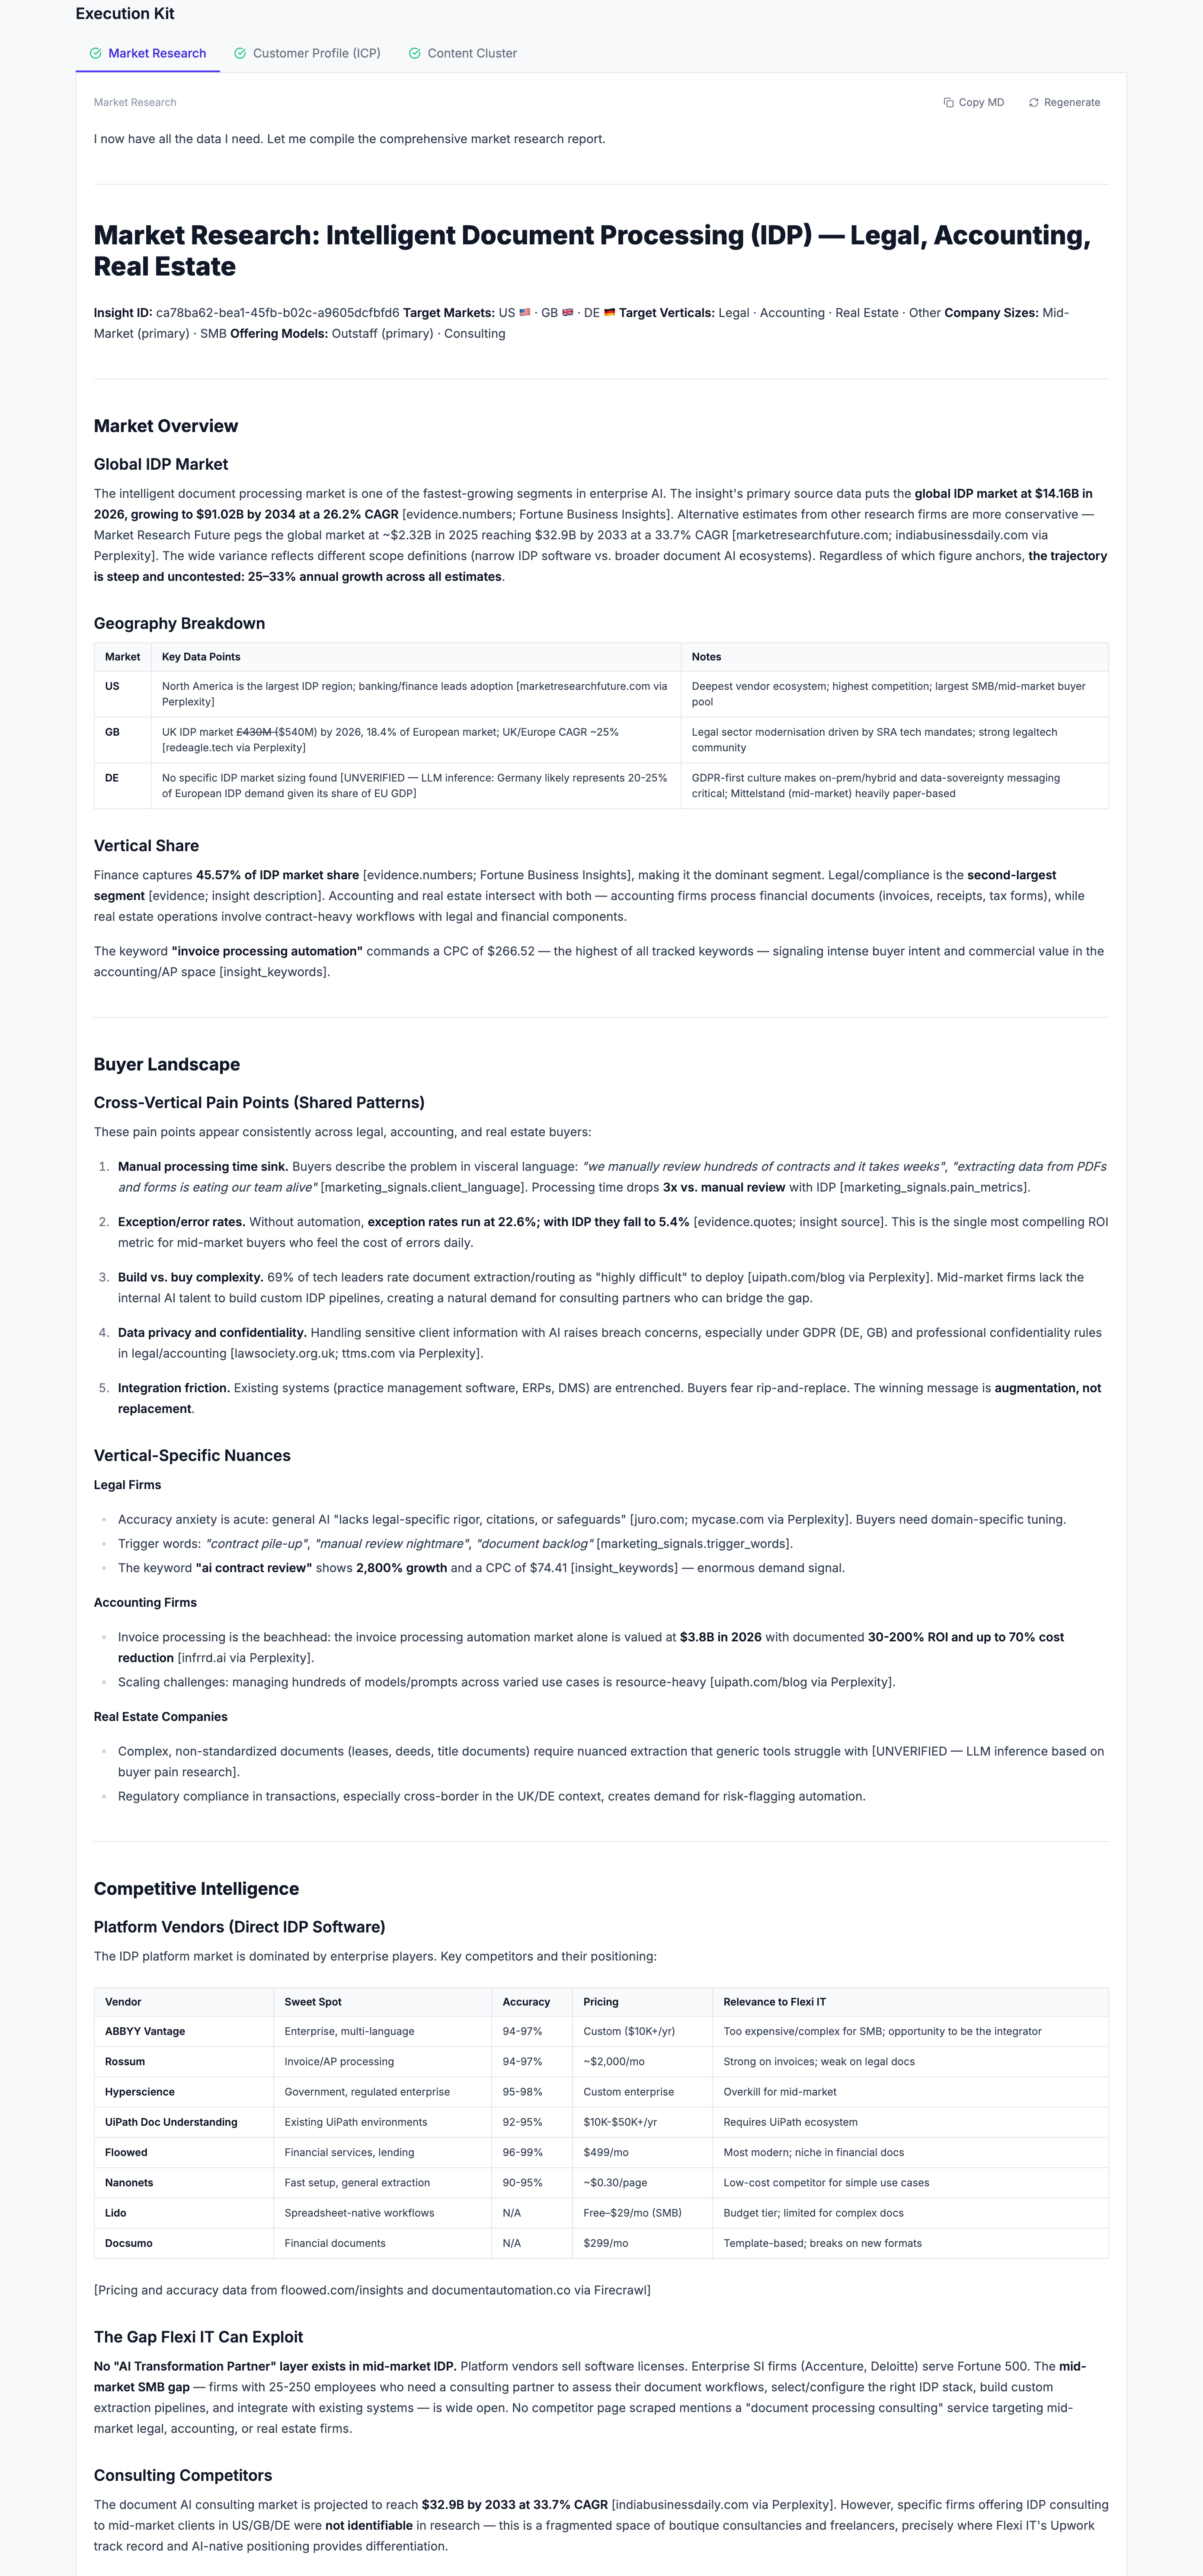
Execution Kit: a market-entry pack of documents
An insight on its own is just a signal. The Execution Kit answers the next question: how do we make money on this? Who do we write for, with which numbers, on which topics, and using which keywords.
From a single insight, in 5 minutes, the system generates a pack of 4 documents. Instead of paying separate agencies for market research, content strategy, and copywriting and waiting a week, the team gets all of it at once, tied to the market shift the system has already found.
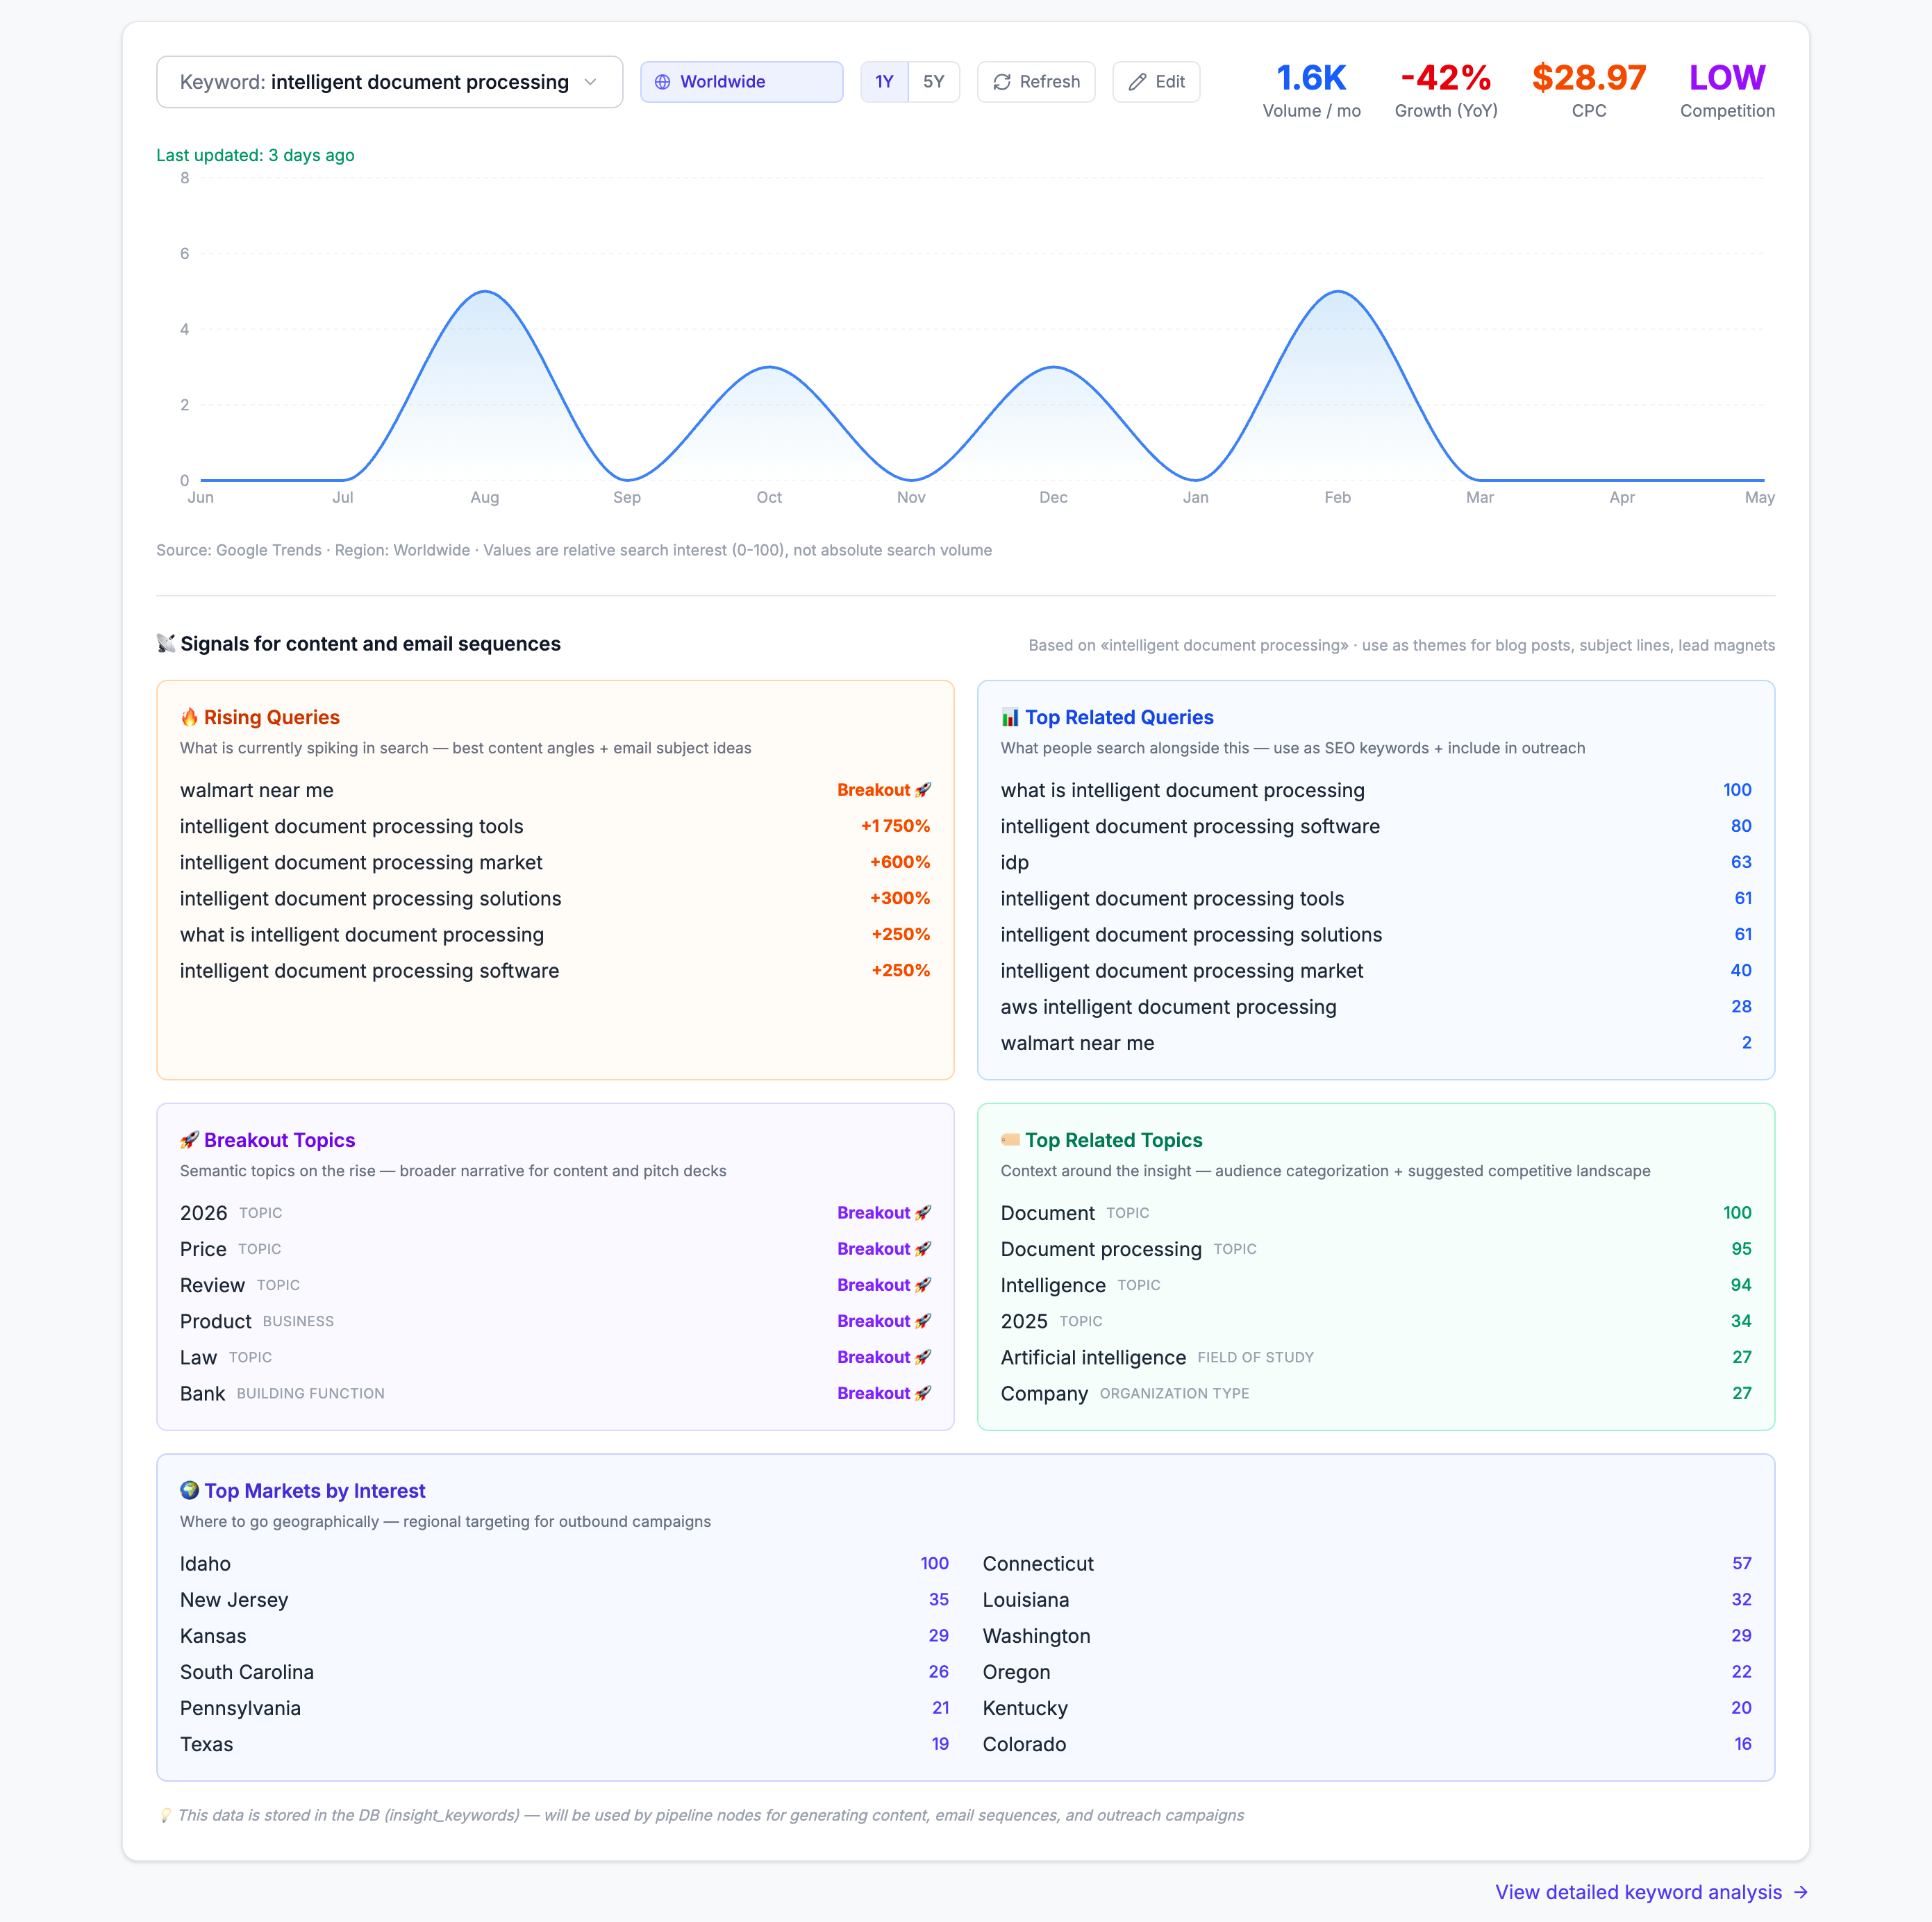
Keyword Analysis is generated even before the Kit, during the validation step. There are 10 keywords per insight, with metrics from DataForSEO: search volume, CPC, competition, growth %, trend history, and geographic interest. The mix covers head terms, mid-tail, and long-tail. Branded keywords from competitors are recognized automatically.
Market Research. A market brief that covers market size and growth dynamics, buyer pain points by vertical, terminology, competitors, price benchmarks, and the key numbers with citations for every source. Every number either has a link to its source or a "needs verification" tag. The system doesn't make up statistics; it flags what still needs to be checked by a person. The CEO reads it for a go/no-go decision on a vertical. Sales uses it as a discovery cheatsheet before a call. Marketing uses it as the anchor for landing pages.
Customer Profile (ICP). A portrait of the ideal customer, tied to the insight and your settings (vertical, geography, company size). Six sections: personas with concrete job titles and team sizes, decision makers (who approves the budget vs. who implements), pain points with research citations, buying triggers, qualification criteria, and an anti-ICP (who to deliberately avoid).
Content Cluster. A quarterly content plan with one main article per vertical and 4-6 supporting articles around it. Each entry has verified keyword volumes, CPC, a check on whether Google's AI Overview shows for the keyword, and a map of internal links between articles. Marketing gets a finished content plan without brainstorming, and every article already has a keyword with volume and competition data.
One click generates an email sequence on top of this pack. A separate planner agent reads all 4 documents and the company's voice-style document (the brand's tone of voice) and builds a cold sequence with trigger words from the ICP and links to relevant case studies. The campaign is ready in Snov.io in 5-6 minutes per vertical.
The loop closes through metrics. Open, reply, and bounce data from Snov.io flow back into the system. If an insight produces a 0% reply rate, its score is automatically lowered in the next run, and the system learns which insights convert versus which ones just looked strong on paper.
Adapting to your business
The architecture stays the same: research workflow, trust check, dashboard, Execution Kit. What changes per vertical:
- Where we look. Which sources to monitor: industry publications, professional bodies (AICPA, SHRM, ABA), regulatory feeds, communities (LinkedIn groups, Reddit, forums, Slack groups), demand signals (Upwork, Indeed, RFP databases), competitor websites, marketplace data. In some verticals the main signal is live job postings. In others it's regulatory changes. In others it's social trends.
- How we group findings. What you use to tell insights apart. For a law firm, it's practice areas; for a marketing agency, services; for e-commerce, product models.
- How often we run it. Hourly for breaking-news verticals, weekly for trend-driven ones, monthly for stable ones, quarterly for long sales cycles.
- What we trust. Which sources your business considers authoritative, how strict the trust thresholds are, which kinds of signals to ignore.
- Target markets. Your geographies, languages, and regional regulatory specifics.
Examples by vertical
| Vertical | Where we look (examples) | How we group findings | How often |
| Legal services | Industry media (Law360, Lexology, ABA Journal), regulatory feeds (DOJ, SEC, state bars), competitor firm websites, LinkedIn legal groups | Practice areas (M&A, IP, family law, litigation) | Weekly. Regulatory triggers move fast |
| Accounting / finance | Industry media (Accounting Today, Going Concern), professional bodies (AICPA newsletters), demand signals (Upwork/Indeed accounting jobs), Big 4 and tier-2 firm websites | Services (audit, advisory, tax, bookkeeping) | Quarterly, plus week 1 of reporting periods |
| Marketing agencies | B2B directories (Clutch, G2), trend tools (Google Trends, BuzzSumo), social-first communities (X, LinkedIn), demand signals (Upwork) | Services (paid social, SEO, content, lifecycle) | Weekly. Trend-driven vertical |
| Real estate / PropTech | Industry media (Inman, Realtor.com news), MLS data feeds, regulatory channels (state real estate boards), PropTech competitor websites | Subsegments (residential, commercial, property mgmt, multifamily) | Monthly |
| Recruiting / HR | Industry media (HR Dive, SHRM), job market data (ZipRecruiter, BLS), professional communities, competitor career pages | Areas (executive, tech, healthcare, sales recruitment) | Monthly |
| Newsroom / online media | Wire services (Reuters, AP), social trending (X), regulatory feeds, competitor publications | Beats (politics, business, tech, sports) | Hourly. Breaking-news driven |
| Management / IT consulting | Industry reports (McKinsey, Bain, Gartner), thought leadership (HBR, MIT Sloan), demand signals (RFP databases, Upwork), industry associations | Practice (strategy, operations, IT, risk) | Quarterly |
| E-commerce / DTC | Marketplaces (Shopify trends, Amazon seller forums), social commerce (TikTok shopping, Instagram trends), industry publications (Modern Retail, Retail Dive), DTC communities | Models (DTC, B2B, marketplace, subscription) | Weekly or daily |
Adapting to a new vertical takes 3-4 weeks until the first run. That includes setting up sources for your market, building your own categories around the services you sell, tuning what counts as a trustworthy source in your industry, and a first test run on historical data.
Let's talk
If your team spends a week on manual market research every month, give us 30 minutes and we'll show you how that week becomes 93 minutes.
On your vertical. On your hypotheses. No demo data, no slides, just a working system and real numbers.
Try us for 14 days
Want to start a 2-week free trial period with us? Leave your email below and we'll revert to you shortly with more details