Case studies


From Disconnected Tools to an AI-Powered Decision System
Flexi IT unified SEO, sales, outreach & Upwork data from six disconnected tools into one Laravel platform with AI audits, automated reports, and a single decision layer.

Introduction
Flexi IT was running its marketing, sales, and outreach across six disconnected tools.
Analytics lived in Looker Studio. Reports were assembled by hand each cycle in Google Docs. Lead pipelines were split between Pipedrive, Snov.io, and Lobstr. Data flows broke silently, and failures often went unnoticed until the data was already stale.
Getting a coherent view took hours of manual work each cycle, and decisions were often made on incomplete data. Some channels were reviewed monthly, others only quarterly. By the time problems surfaced, opportunities were already lost.
We wanted one place to look, one workflow per task, and a system that turned raw data into prioritised actions. FlexiDashboard is what came out of that.
Impact
| Review cadence | monthly / quarterly → continuous, cross-channel |
| Tool unification | disconnected platforms wired into one operations layer |
| Manual reporting eliminated | weekly, monthly, and quarterly memos generate automatically |
| Decisions, not metrics | AI-generated insights deliver prioritised actions, not raw metrics |
Challenge
Flexi IT relied on a stack of disconnected tools that didn't talk to each other:
- Looker Studio for analytics dashboards. Every connector configured separately, broke when source schemas changed, no cross-source logic.
- Google Docs for monthly and quarterly reports, written from scratch each cycle by copying numbers out of six different UIs.
- n8n for enrichment workflows. Fragile glue scripts that failed silently with no audit log.
- Six source systems (Google Search Console, Google Analytics 4, Upwork, Pipedrive, Snov.io, and Lobstr.io), each with its own model of the world.
The issue wasn't the tools. It was the absence of a system tying them together. Cross-source questions had no direct answers, only manual stitching. Failures hid inside individual workflows. There was no shared model of "the business" that any single tool could speak to.
What we needed wasn't another dashboard. It was a system that brought data, workflows, and decisions into one layer.
Solution
We built FlexiDashboard, a single Laravel 12 application organised into domain modules. Every external service is synced into a local database on a schedule, so every chart and report runs on local SQL with full historical depth, not on someone else's API rate limit.
On top of the data layer, we added two things our previous stack couldn't deliver: an AI insights layer powered by Claude that generates audit reports per module with prioritised findings and concrete next actions, and a periodic-report engine that produces owner-facing weekly, monthly, and quarterly memos automatically.
The same review that used to take a quarter now happens in minutes, in a single interface, with full context.
Built with AI
We'd wanted to build a system like this for years, but never quite justified the time or budget. A platform of this scope would historically have taken our team close to a year of focused development. AI-assisted development changed the economics. The core shipped in weeks, with a small team pairing with Claude end-to-end through architecture, schema design, services, controllers, and tests.
The same approach has already produced a second internal product. When FreshBooks stopped fitting our invoicing workflow, we replaced the subscription with a custom Laravel application: full invoice lifecycle for multi-currency clients, with prepayments, credit invoices, and branded PDF generation. Built and deployed in days.
The pattern is becoming a strategy. Identify expensive SaaS subscriptions that almost fit, then replace them with bespoke tools built fast with AI assistance. Several more candidates are on our internal roadmap, and it's the same approach we now bring to client engagements.
Key Capabilities
System snapshot
The unified dashboard at /dashboard surfaces every module as its own card — KPIs, AI audit access, and a click-through to the deep page. Three of them at a glance:
Each module has its own deep page, covered below.
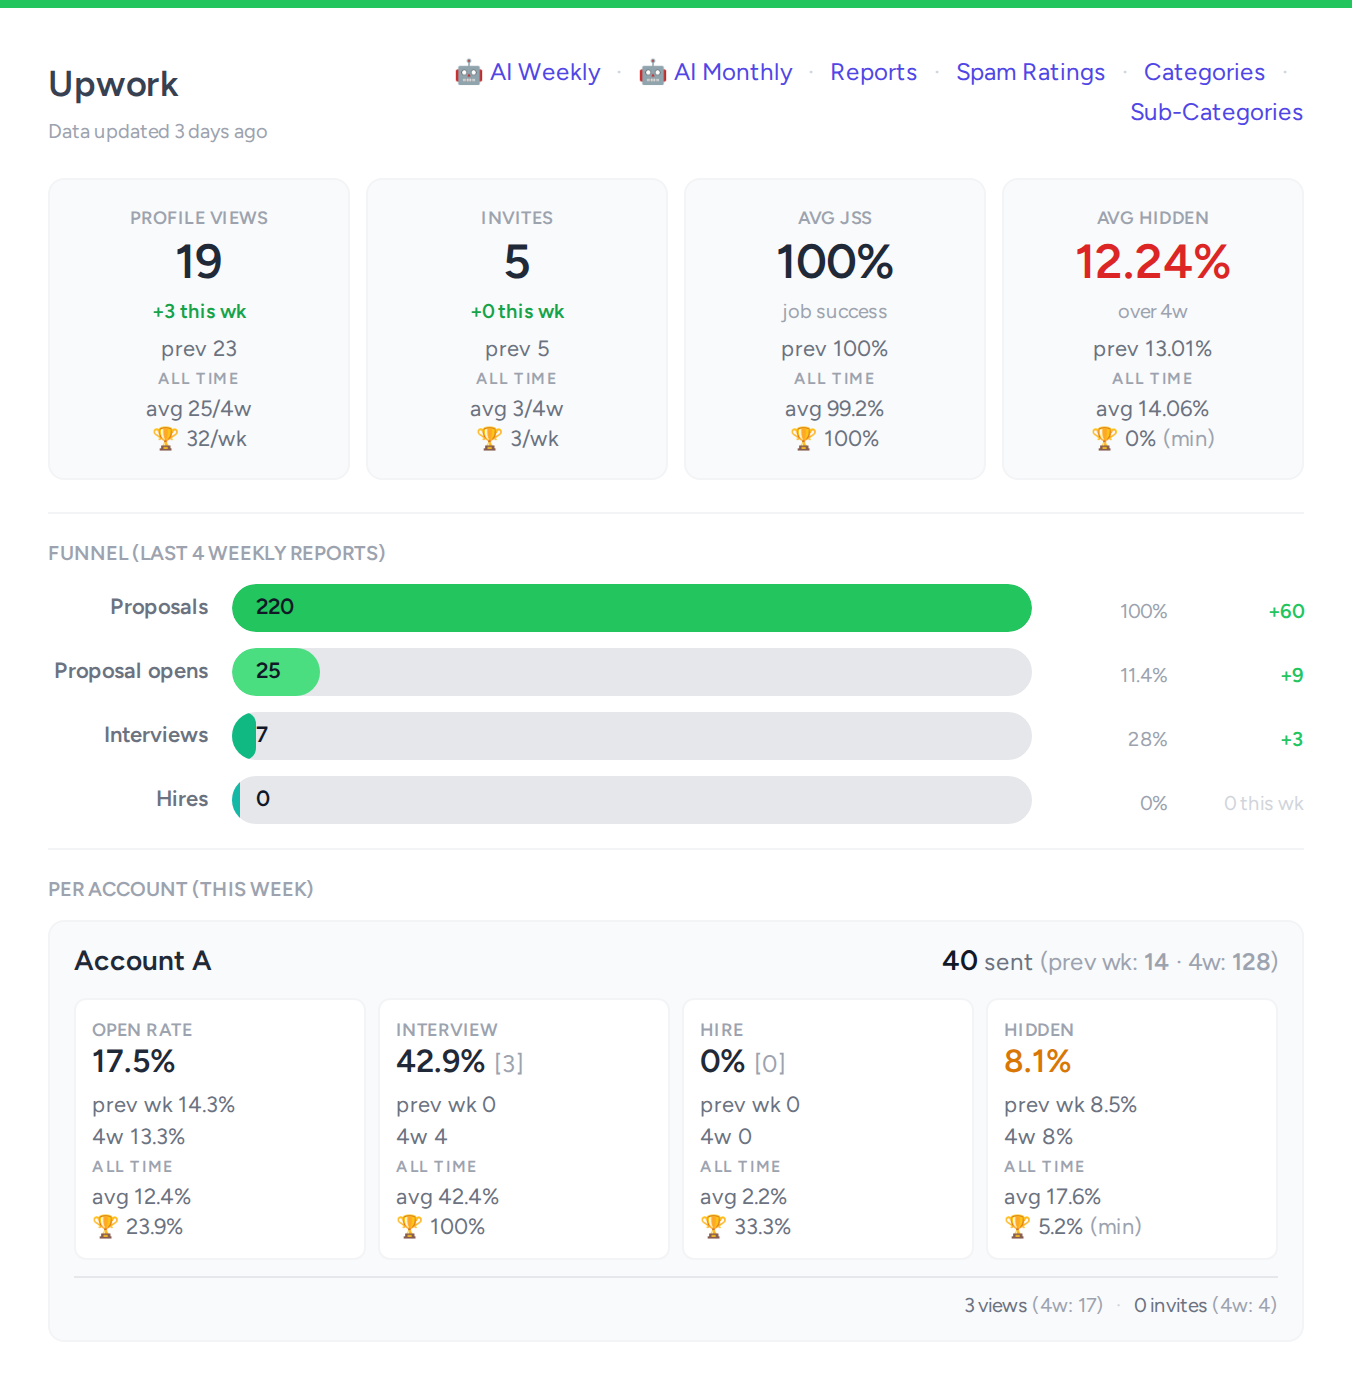
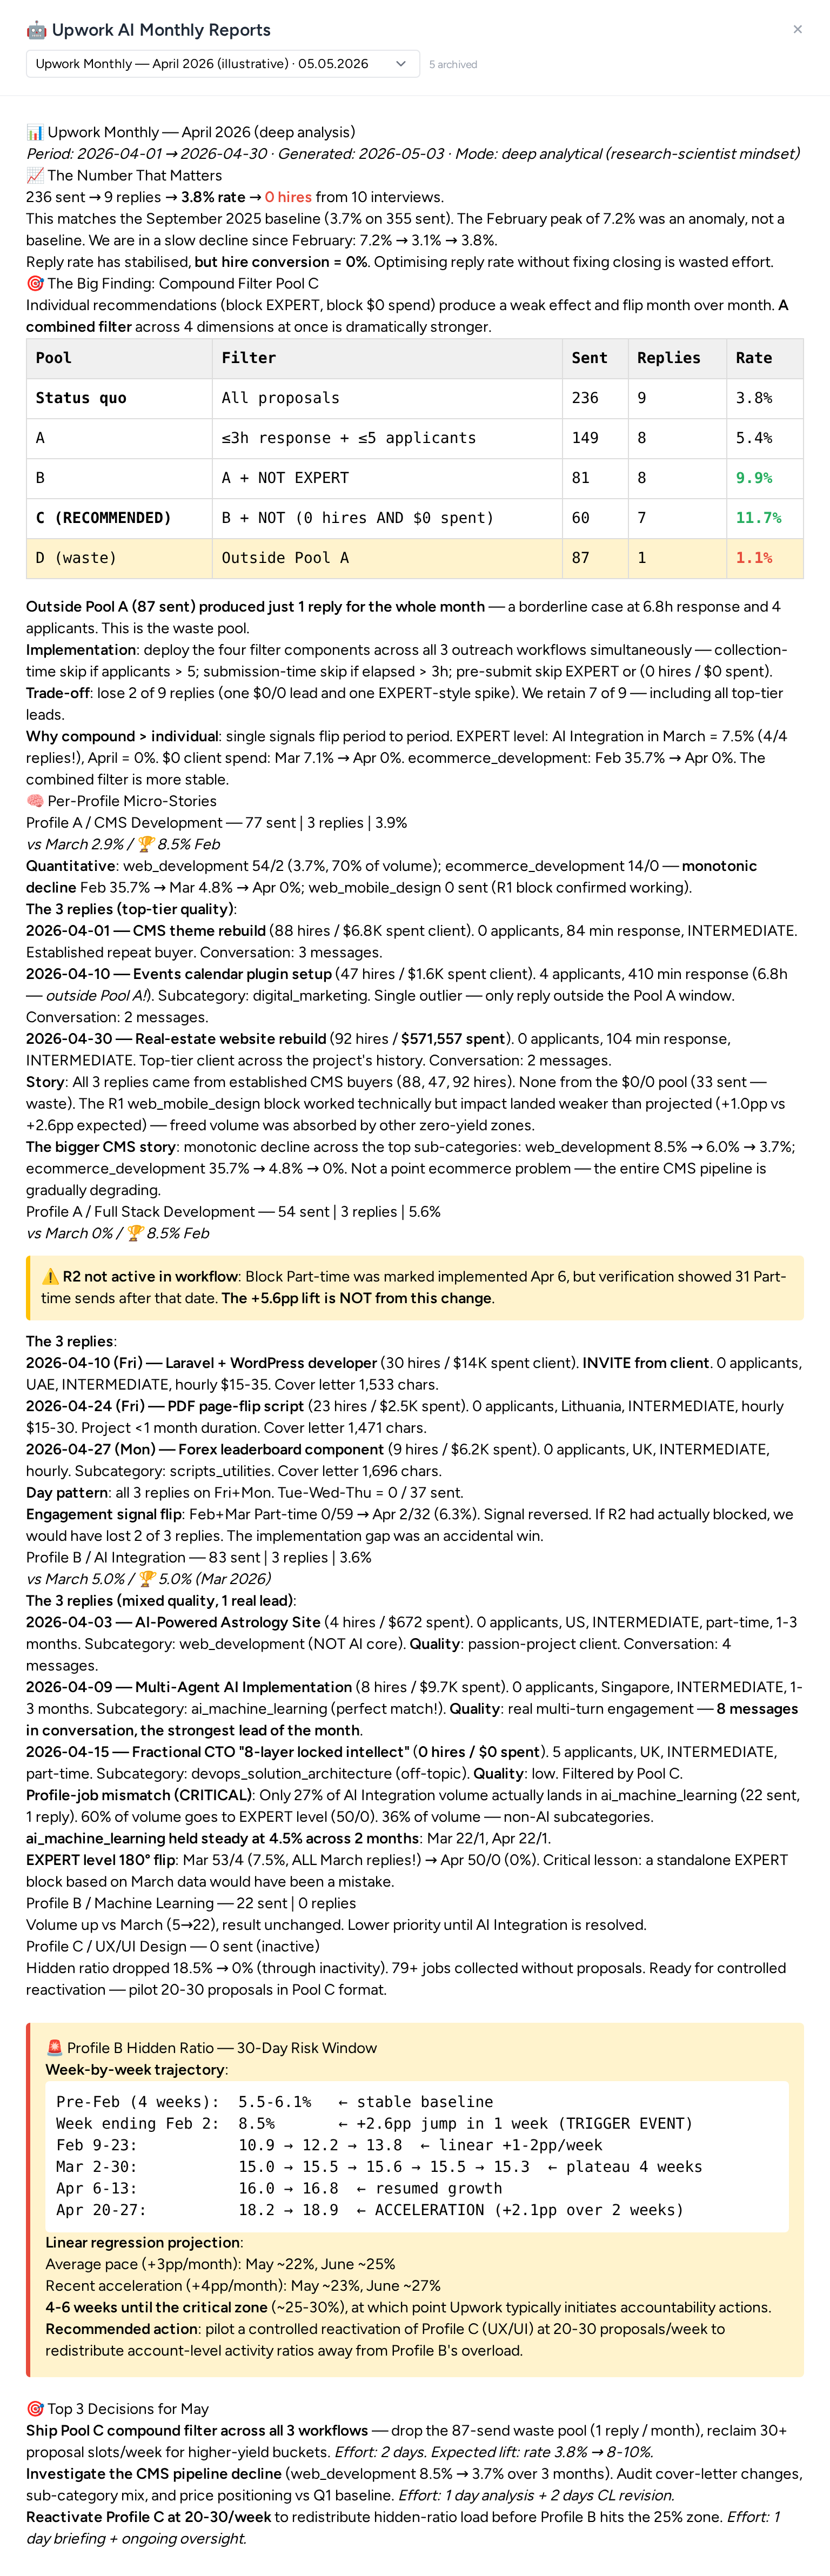
Upwork performance intelligence
Tracks every proposal sent across multiple agency profiles, measuring conversion through the full funnel (sent → view → interview → hire) and surfacing per-profile trends week by week.
Going through Upwork's API exposed signals the standard dashboard hides, giving us a richer picture of account health and letting us react faster when something shifts. Four layers add to the operational view:
- Account spam-rating monitoring:tracks the share of proposals Upwork silently filters as spam before they reach clients. A leading indicator of account health that climbs when something's off in our submissions.
- Category trends: shows where Upwork demand is shifting and how our own application volume follows it.
- AI proposal feedback: Claude analyses our cover-letter text against response-rate data and suggests concrete edits to lift conversion. Runs as a complementary process today; dashboard integration is in progress.
- Monthly AI audit: Claude runs a deep monthly review of the proposal pool, surfacing what's working, what's failing, and what to change next.
Replaces a spreadsheet that Upwork operators used to maintain by hand.
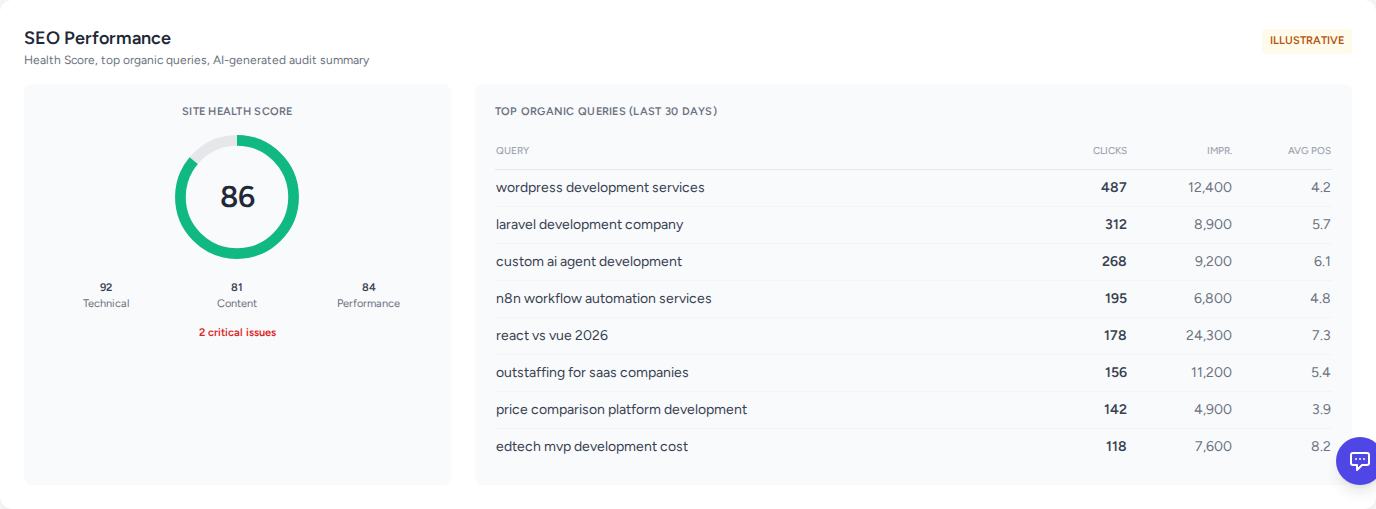
Multi-tenant SEO Suite
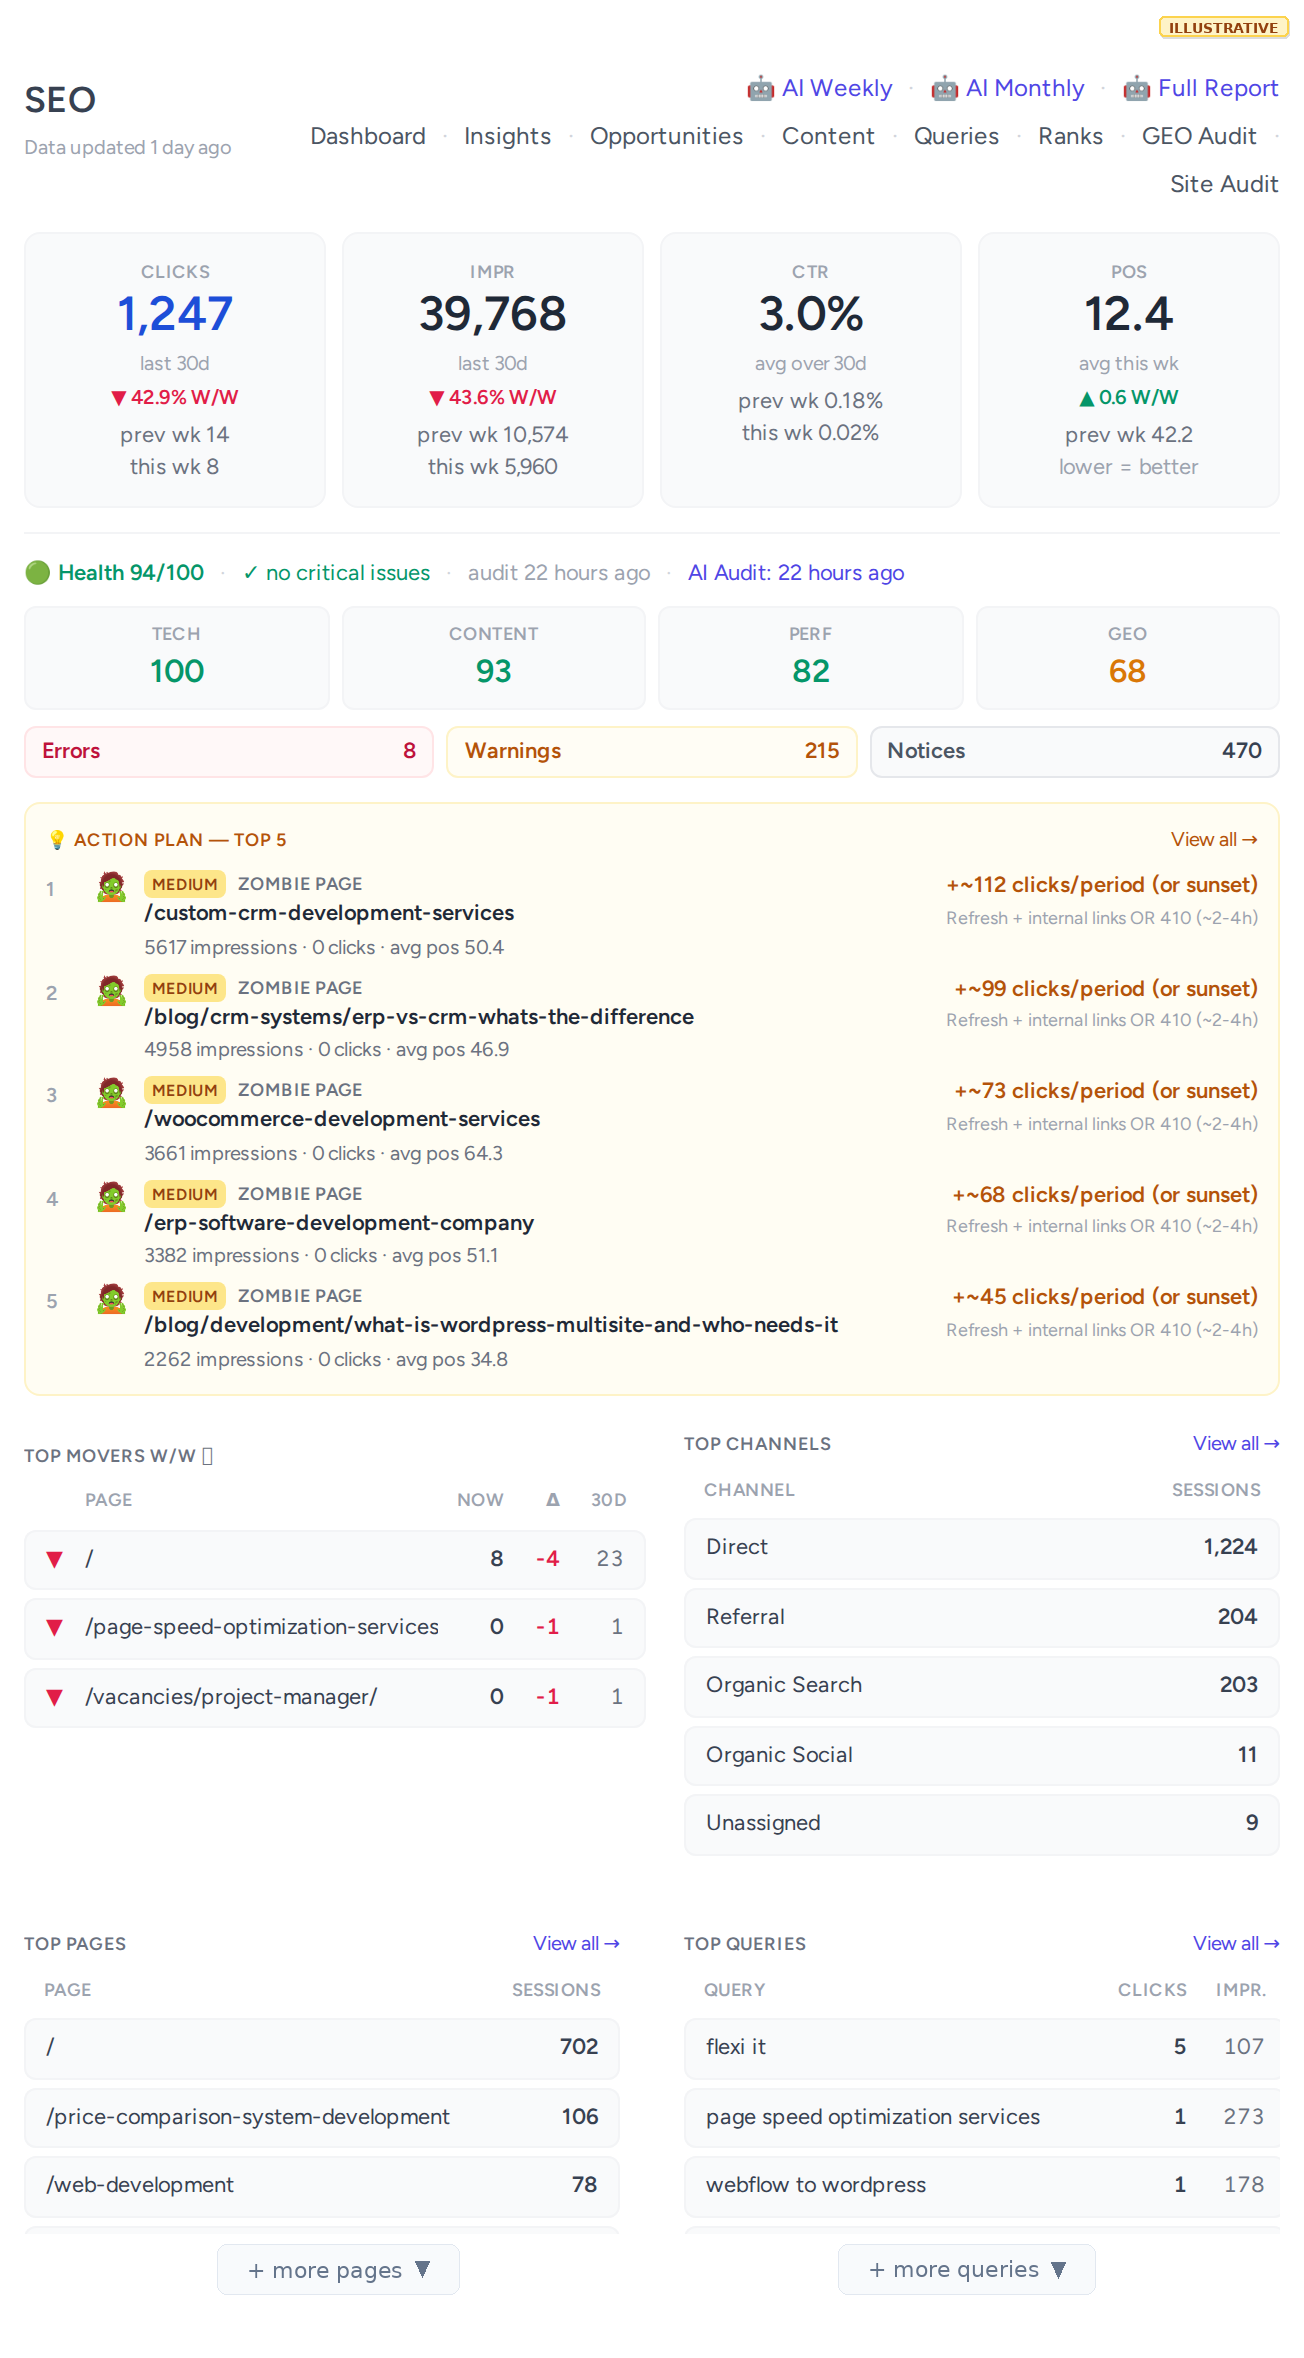
A full SEO platform built from scratch on top of GSC, GA4, and our own crawler. The data layer normalizes URLs across GSC and GA4 and joins them per-URL, a cross-source view most SEO tools don't provide out of the box. Site Audit runs daily, applies 25+ technical rules, and produces a calibrated 0–100 Health Score with severity-coded issues and human-readable "how to fix" guidance.
On top of this data layer, the suite includes:
- Page Intelligence: per-URL deep dive (traffic, queries, CTR, technical issues, internal links) joined across GSC and GA4.
- Opportunity Score: striking-distance keywords, cannibalisation detection, traffic forecast for "if you push this query from position 15 → 5".
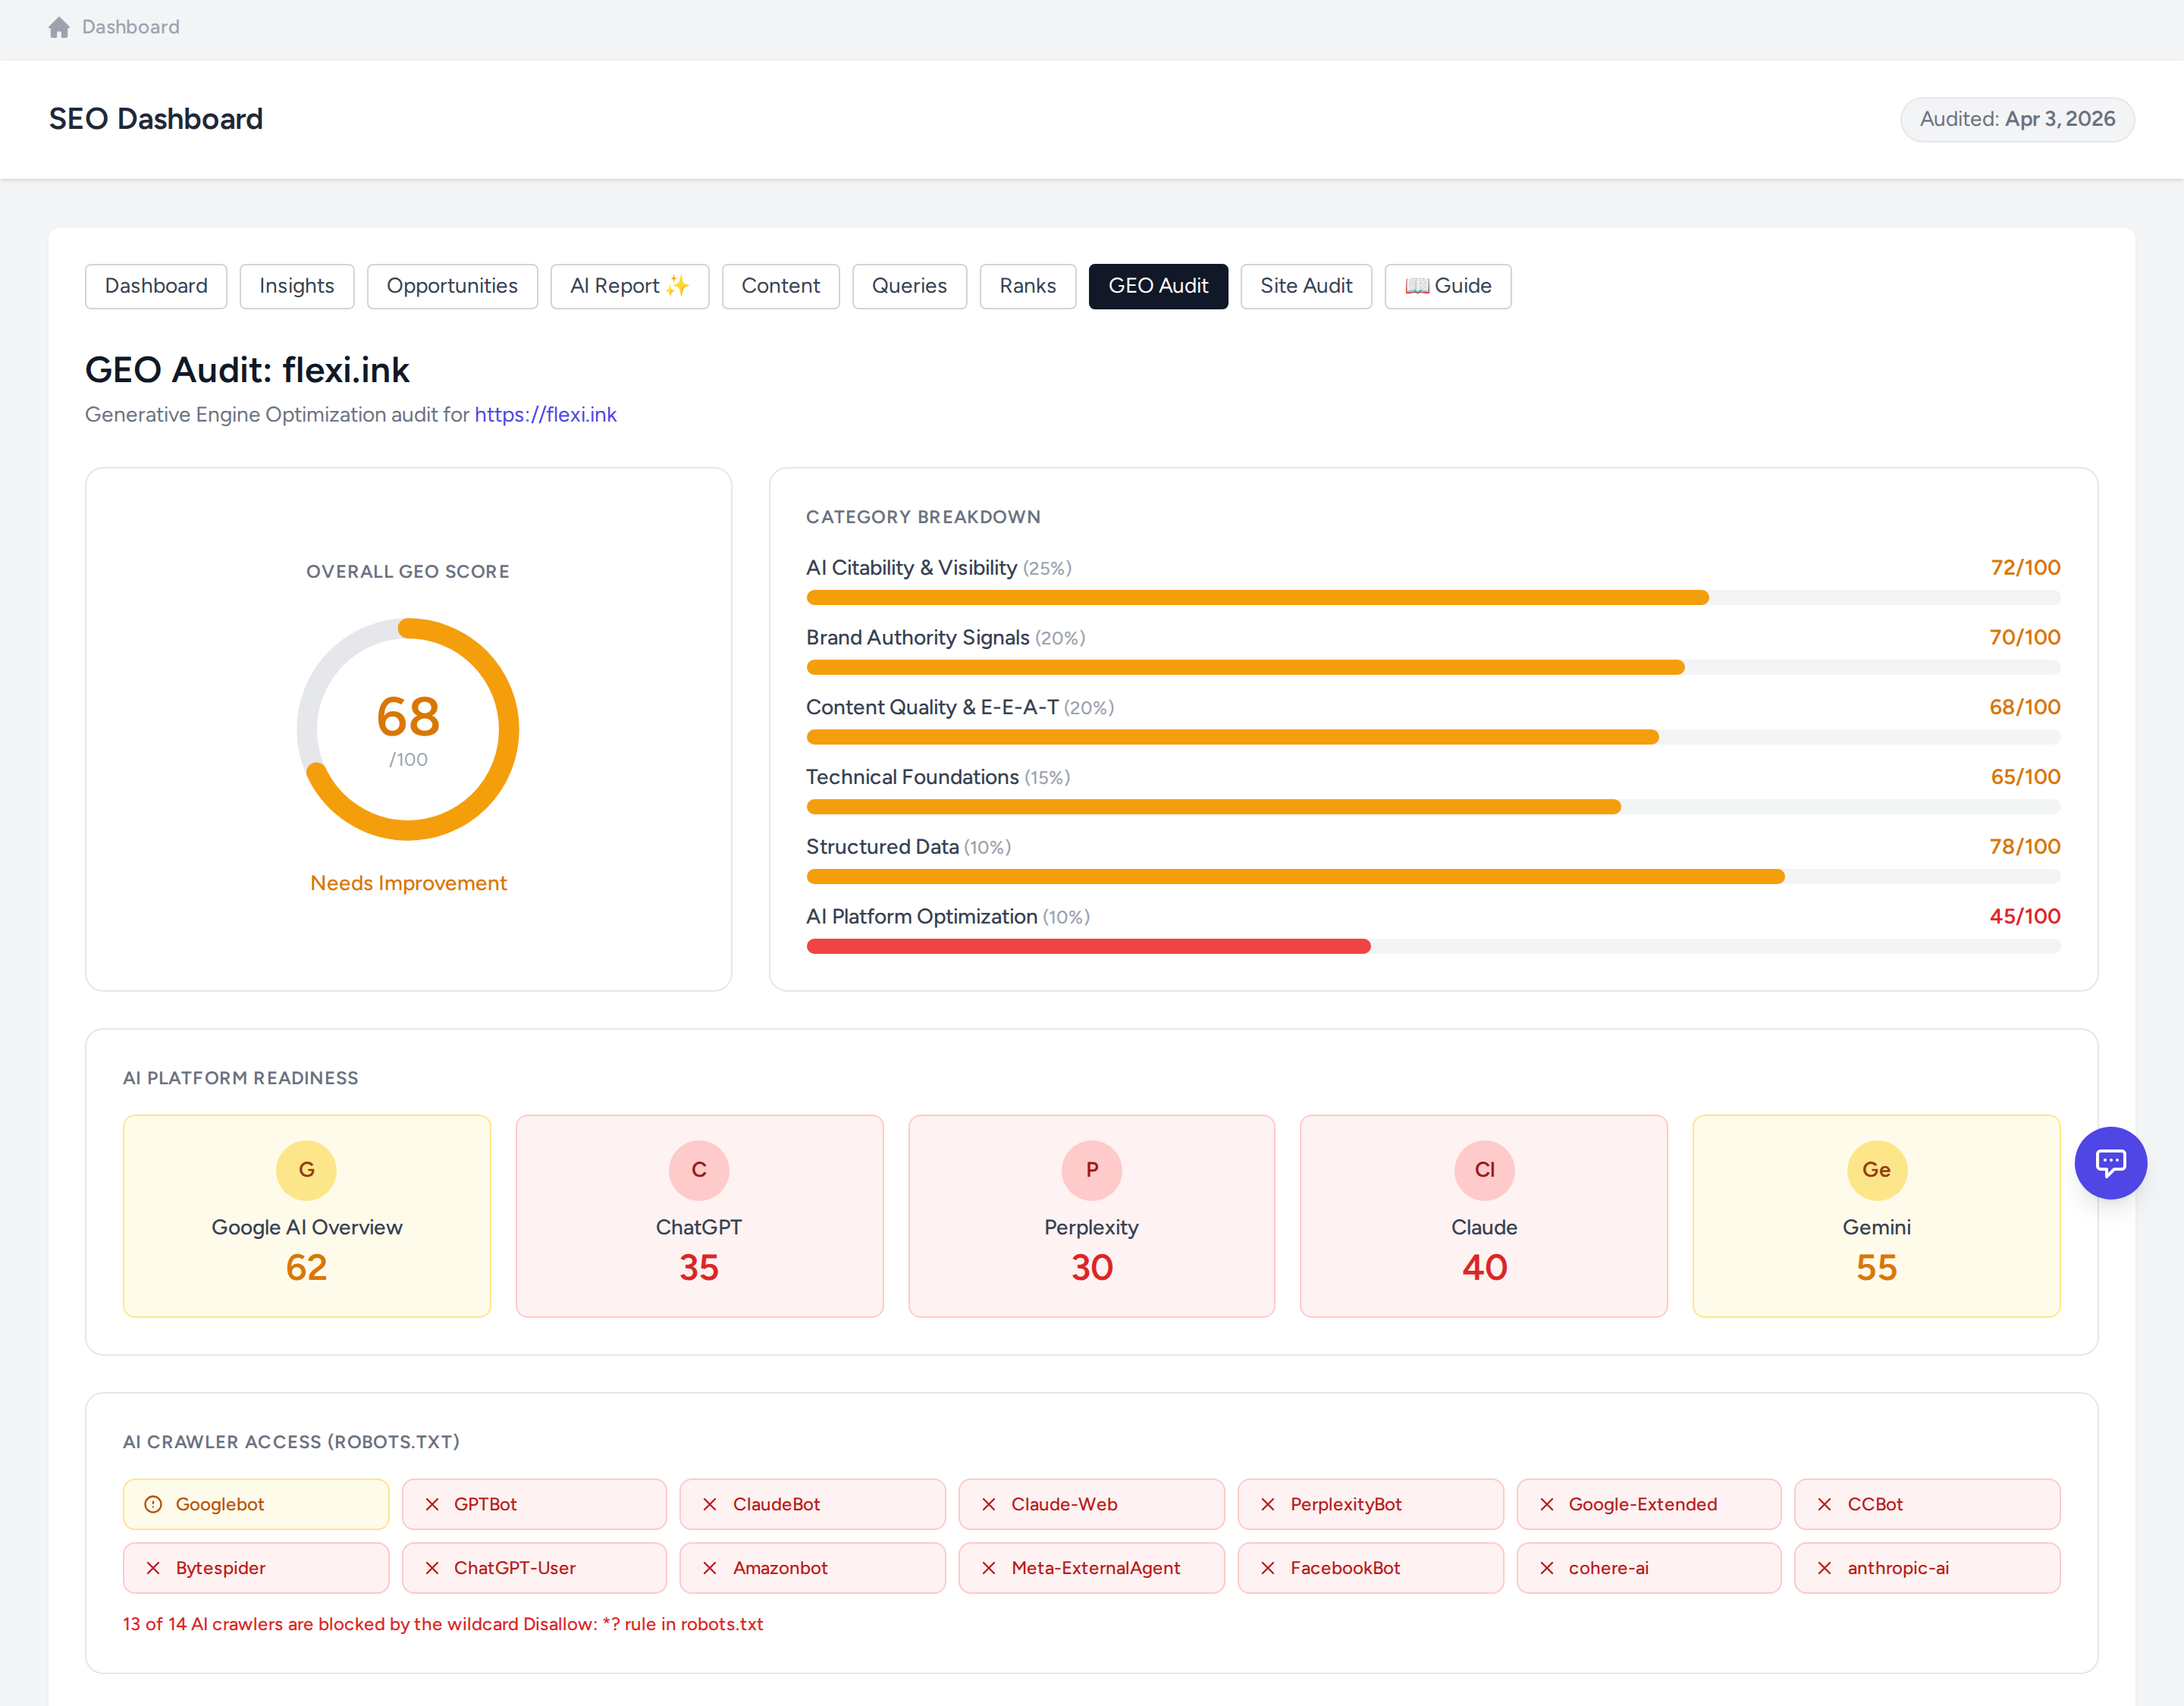
- GEO Audit: scores the site against AI citation patterns (content citability, brand authority, schema, depth) for AI-search readiness, with concrete fixes per category.
- Rank tracker + competitor tracking: position trends per query, cluster comparison against named competitor sites — running on our own crawler, not someone else's data feed.
A site-level insights view, article-level content analytics, and query-level deep dives sit alongside. Backlinks tracking and keyword expansion are in flight.
The suite is multi-tenant from day one (every table is scoped by project), which means it can host multiple client sites and ship as a productised service.
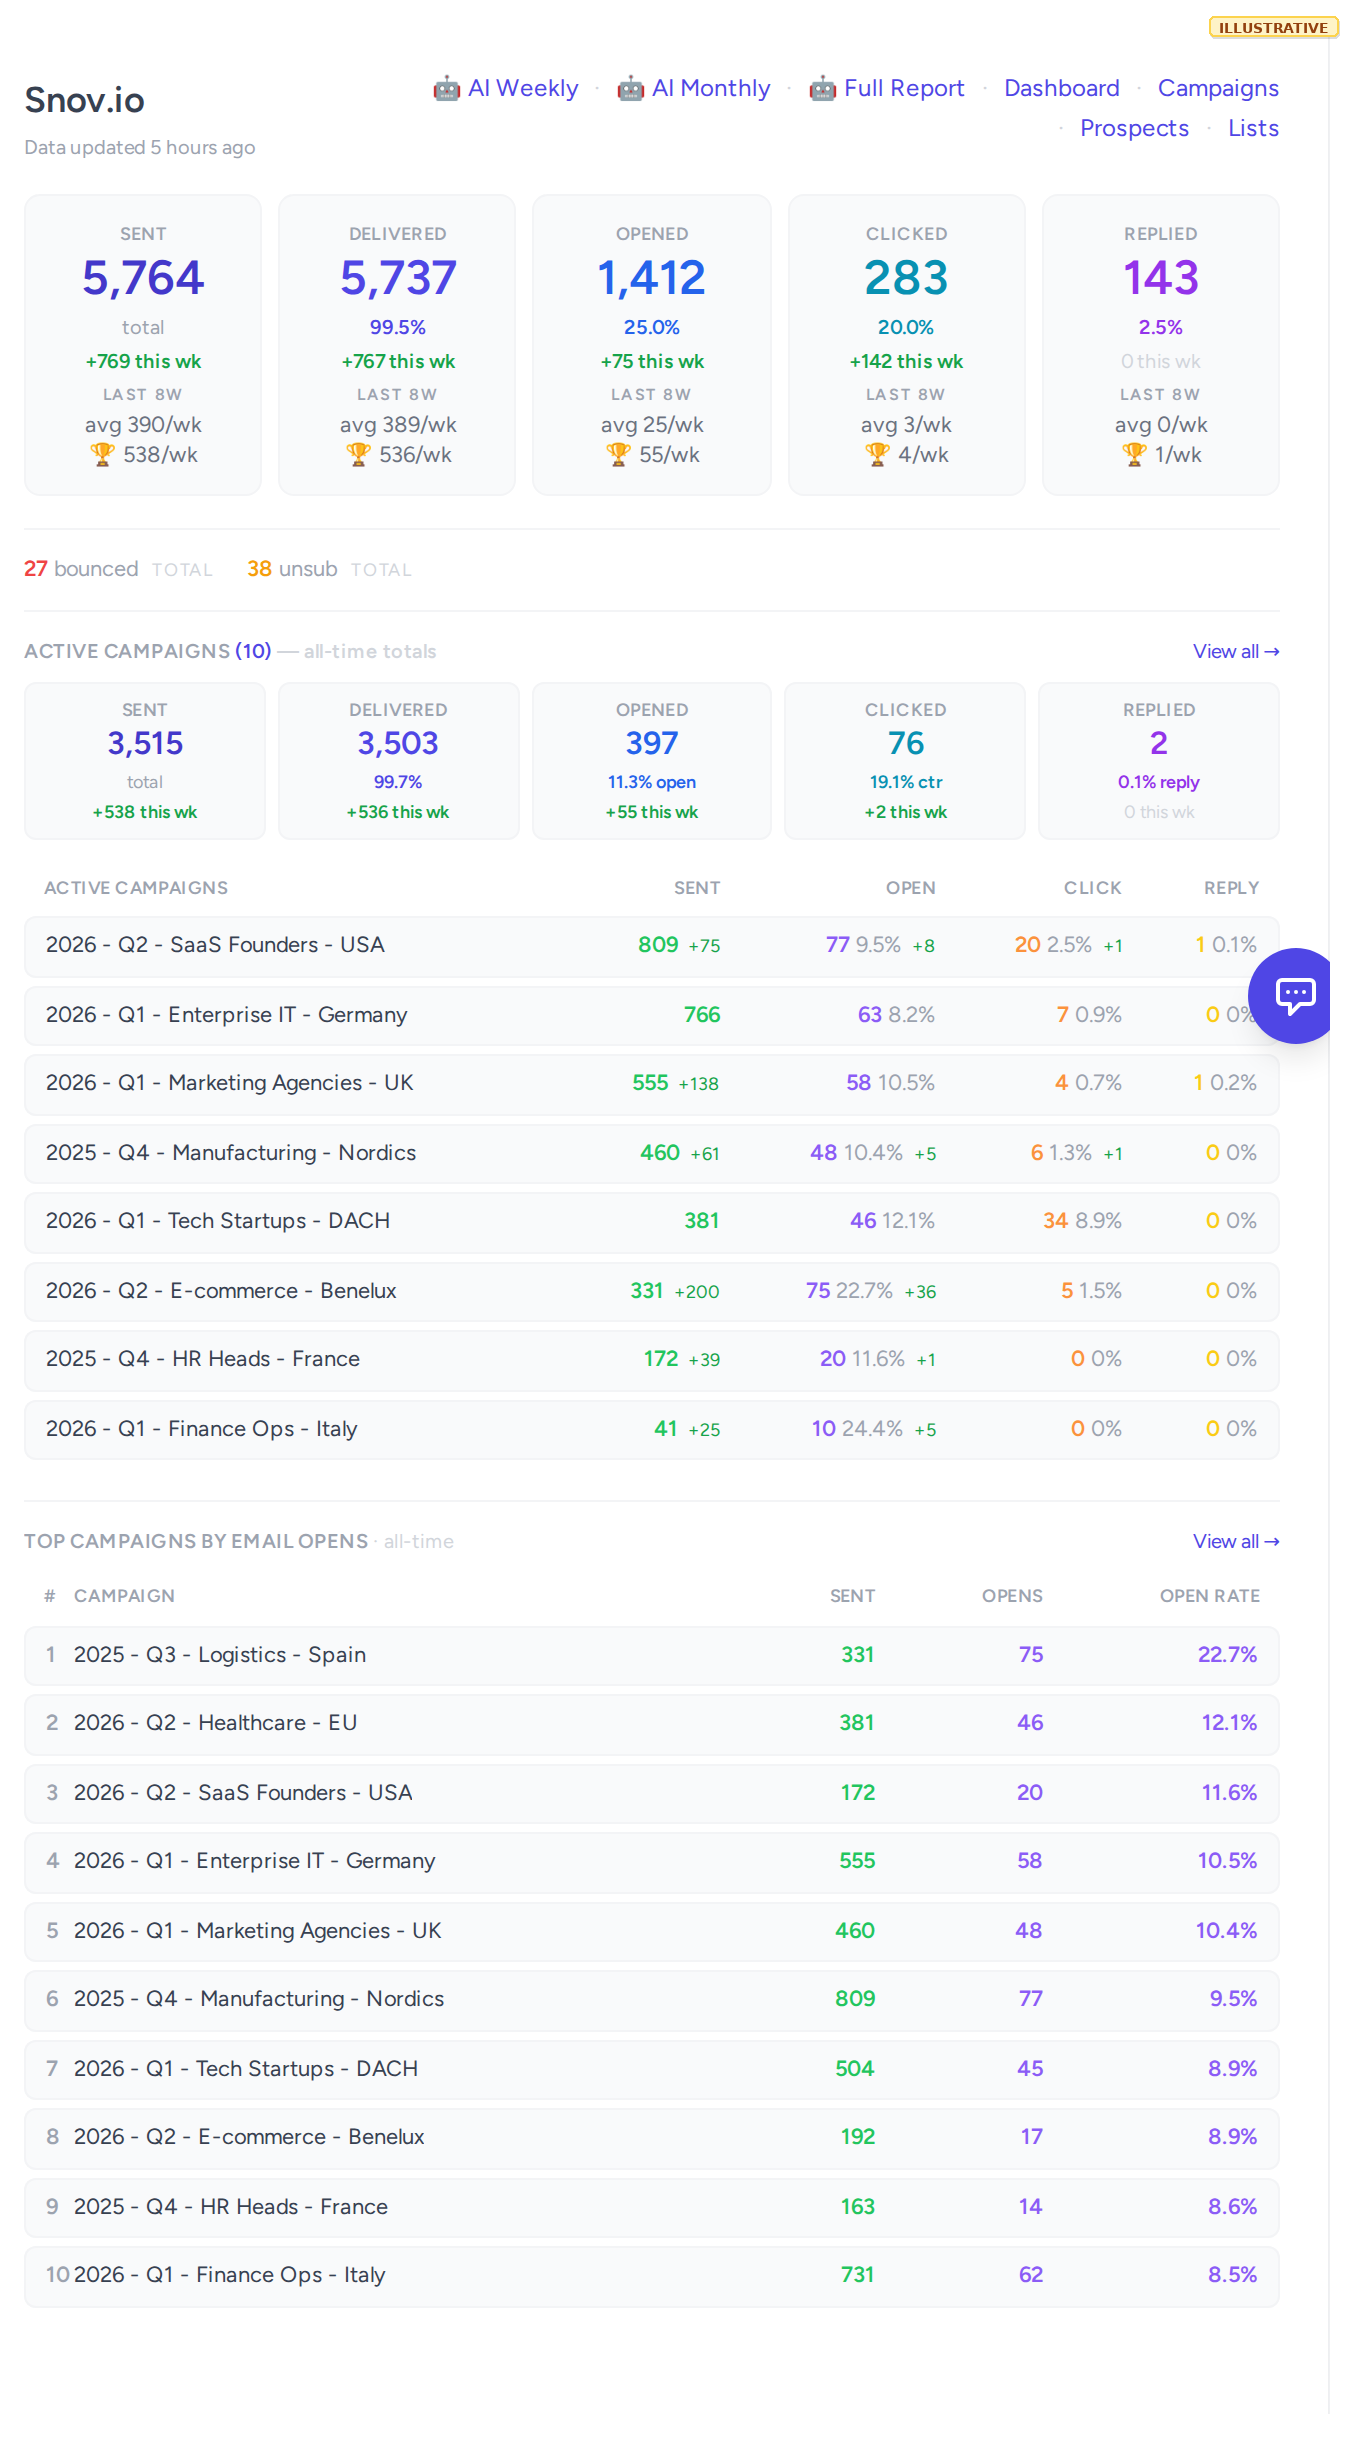
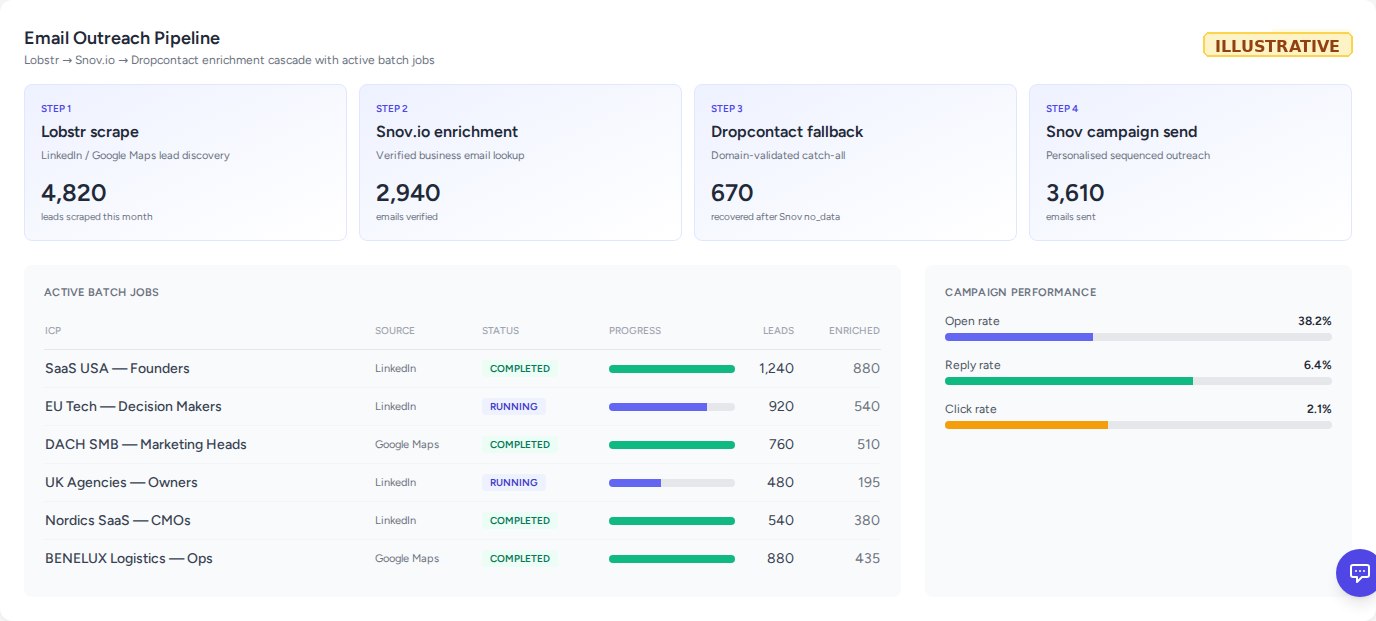
Email outreach pipeline
A full Lobstr.io → Snov.io → Dropcontact enrichment cascade. Lobstr scrapes leads from LinkedIn, Google Maps, and other sources. Snov.io enriches with verified business emails. Dropcontact picks up where Snov returns no_data, with strict domain validation to reject mismatches.
ICP filters, batch jobs, position-group presets, lead-deduplication at intake (no duplicate enrichment, no cold-emailing contacts already in our funnel), and a structured per-stage audit log keep every lead's journey traceable. Silent failures can't hide. Scraped position titles are translated to English and mapped onto a canonical taxonomy, so ICP filters match consistently regardless of source language or spelling.
Replaces a multi-month n8n workflow that broke silently every few weeks. Rebuilt in Laravel with AI assistance, adding capabilities the n8n version couldn't have shipped.
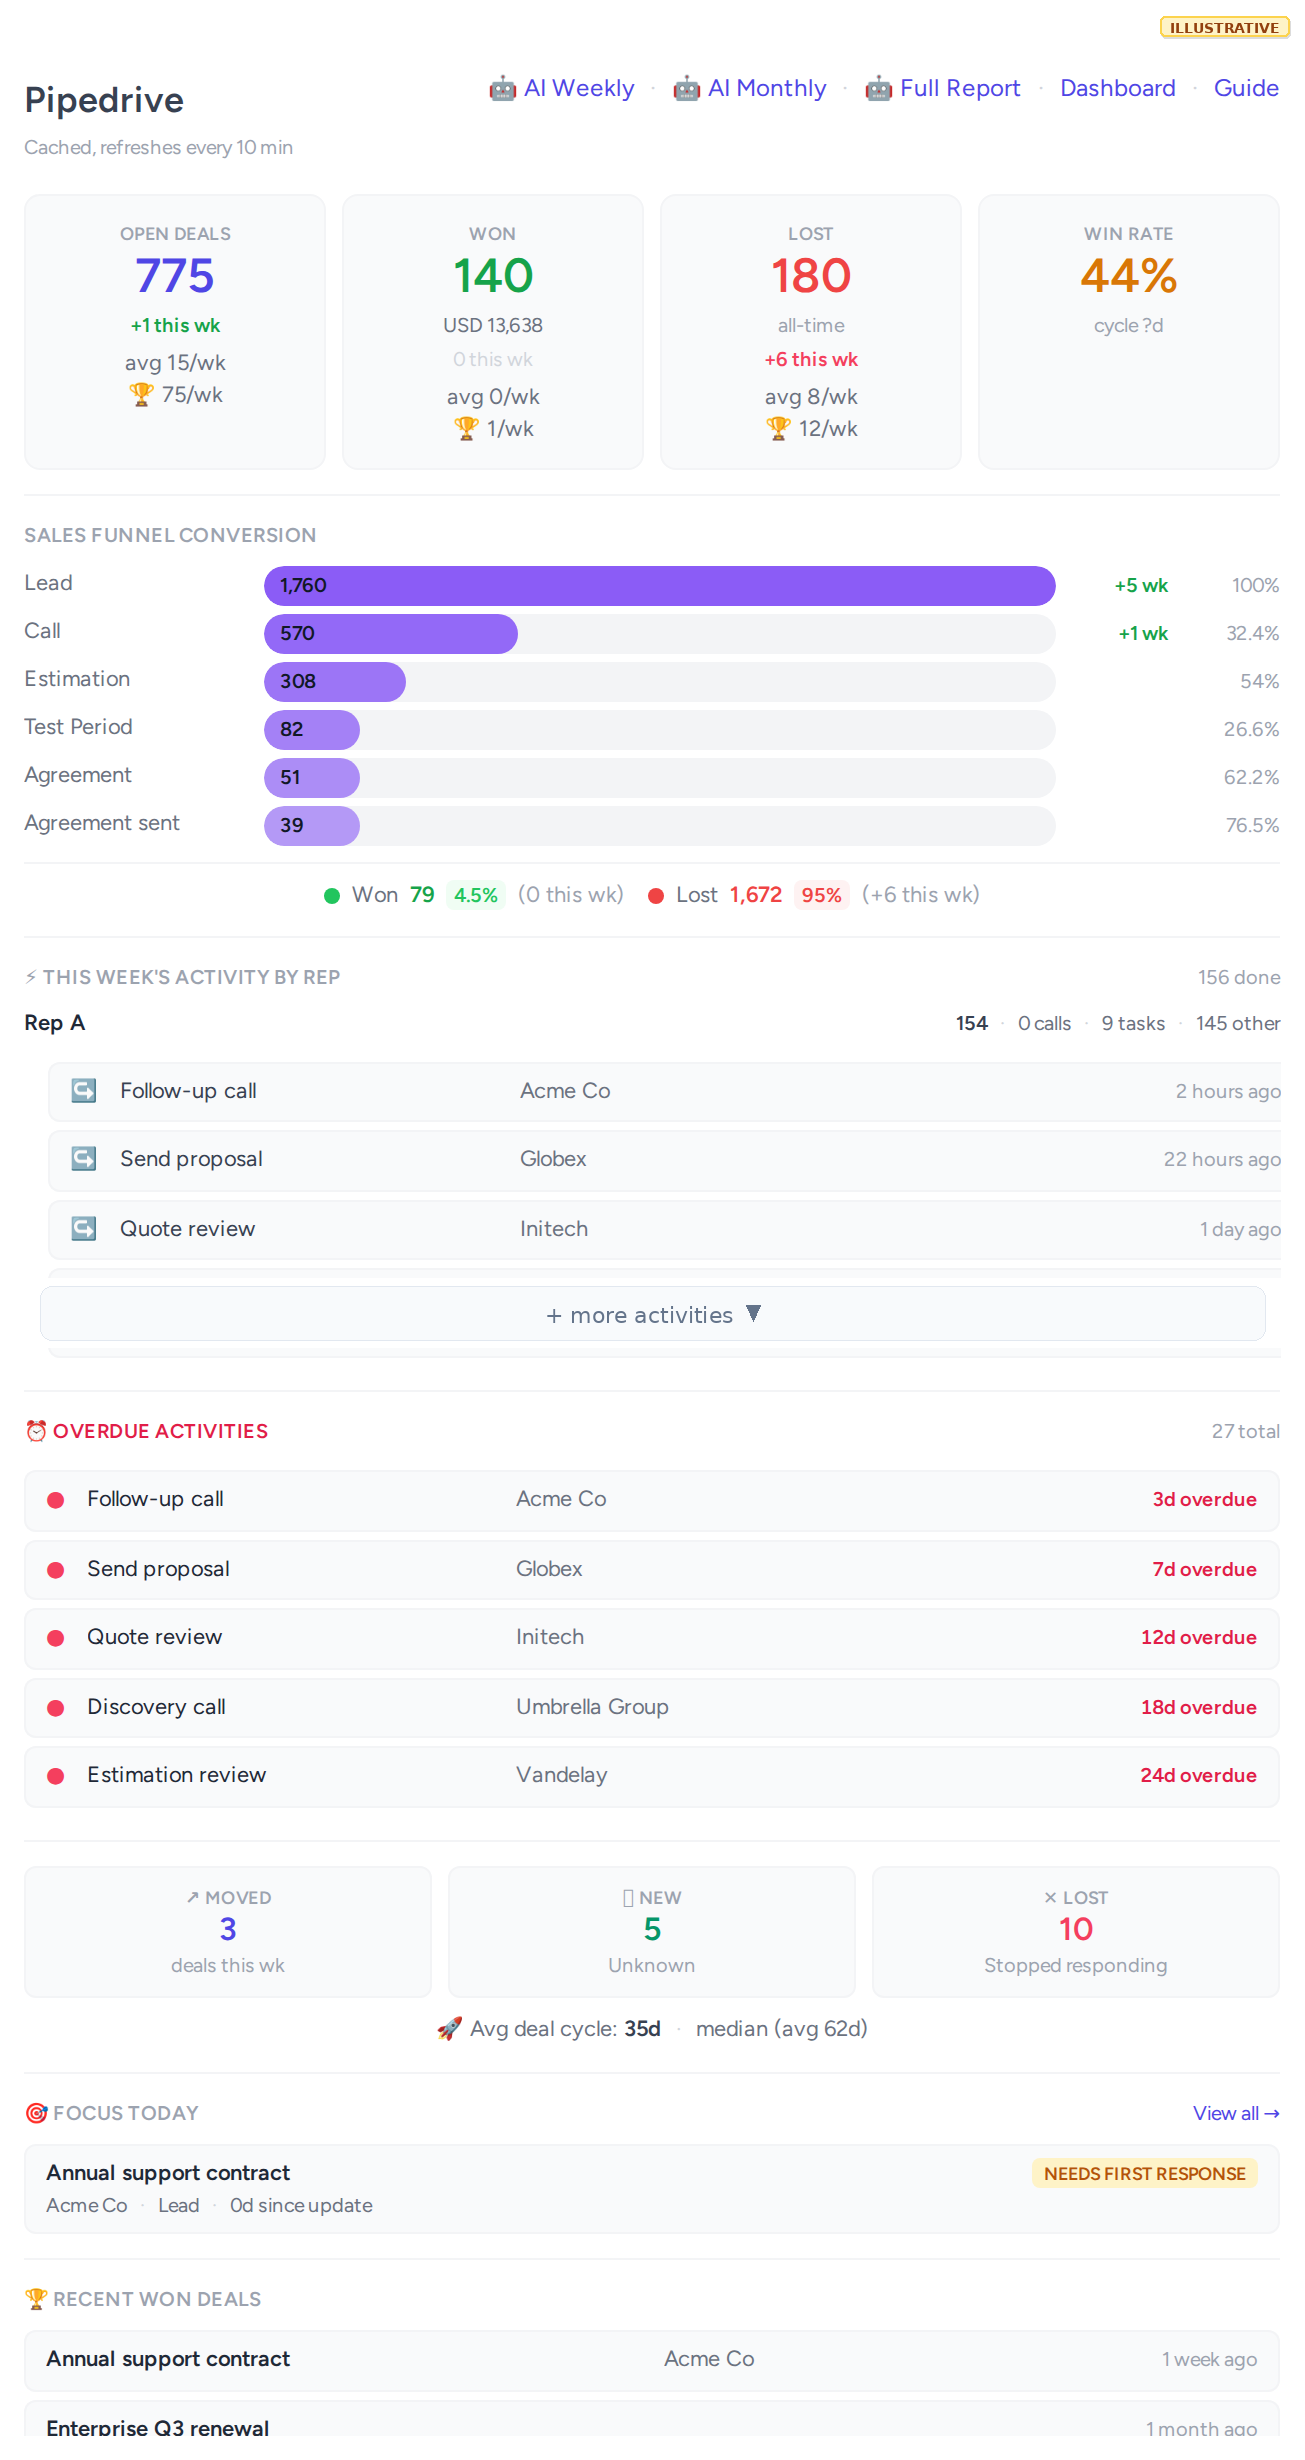
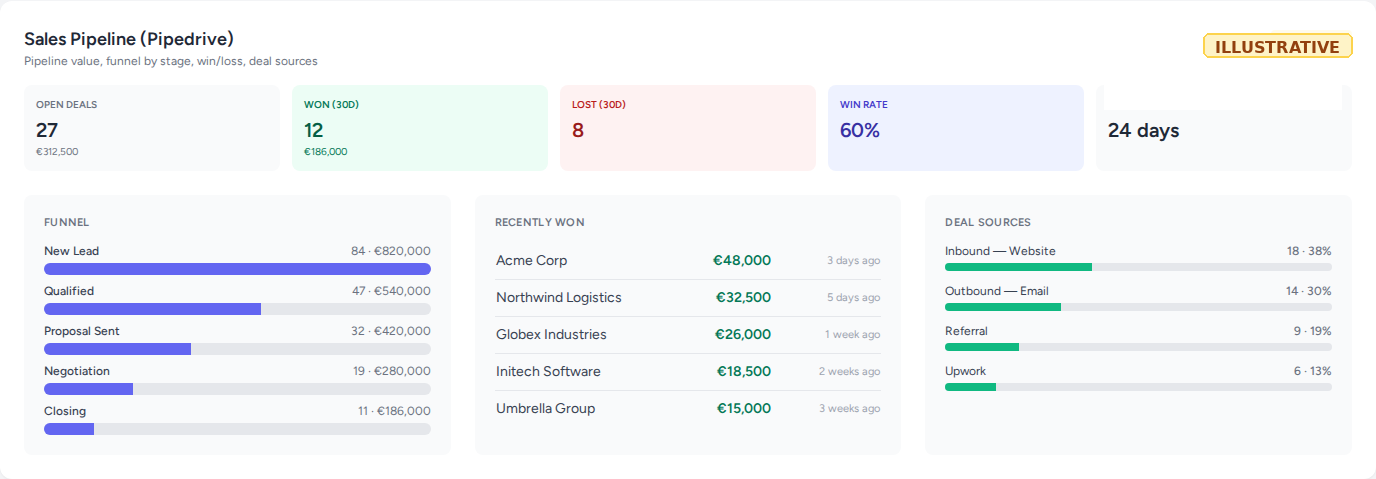
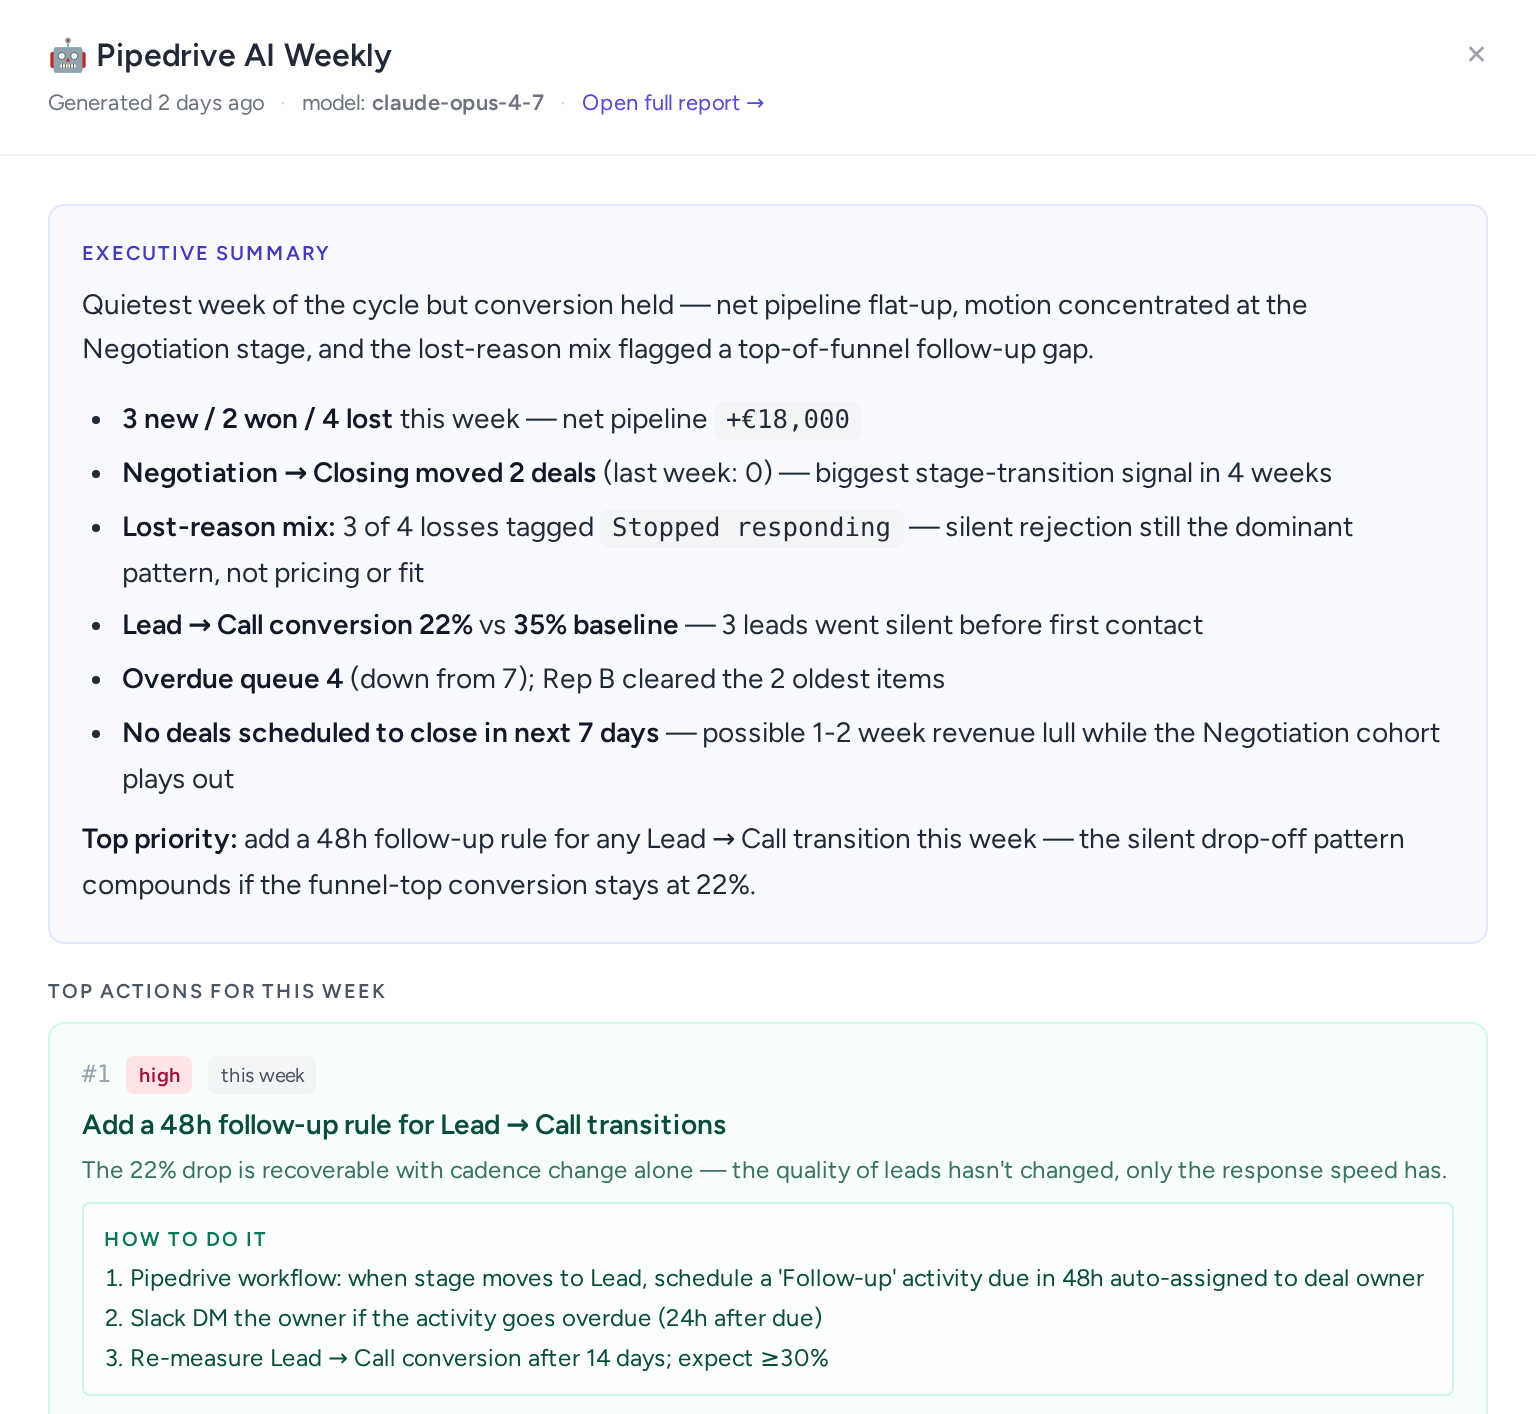
Sales intelligence on Pipedrive
A read-only Pipedrive integration that surfaces what Pipedrive's own UI buries: pipeline value over time, funnel conversion with bottlenecks and per-stage probability, median and average deal cycle time, win/loss attribution by source and reason, and stale-deal lists. Per-rep team activity is broken out separately: calls, tasks, deals moved this week, and overdue items with days-overdue counts.
On top of those linear views sit several cross-cut tables rarely available in standard CRM dashboards:
- Source × Technology Win Rate Matrix: which source/tech combinations actually convert
- Source-to-Stage Leakage: where each source drops deals across the pipeline
- Lost Reason Themes: AI-clustered free-text reasons with top sources per theme
- Technology Breakdown: deal volume and win rate by technology
- Outreach-to-Sales Attribution: links Snov.io contacts and companies to Pipedrive — surfacing the actual match rate of cold outreach into pipeline
Every top-line metric carries its own cadence comparison: this week, weekly average, all-time best. Numbers read against history, not in isolation. A weekly summary card highlights deals moved, new arrivals, and losses with reasons. The AI Audit Report (linked at the top of the page) produces a prioritised action list with owners and timelines (covered in AI Audit Reports below).
Cached for ten minutes, with graceful degradation if the Pipedrive API is down.
AI Audit Reports
Every major module (SEO, Pipedrive, Snov.io, Upwork) has a one-click "Generate AI Audit Report" flow.
Each module carries its own question framework. We wrote the questions a domain expert would want answered ("where is the funnel leaking?", "which queries are stuck on page 2?", "which campaigns are burning prospects?").
Claude pulls a structured snapshot of production data and answers each question with a verdict (good / ok / bad / critical / data_gap), grounded in evidence. When warranted, it produces a concrete action with owner, expected impact, effort estimate, and step-by-step instructions.
Reports come in three cadences:
- Weekly: 4-question framework focused on the last 7 days; output is a top-priority action shipping this week
- Monthly: 8-question framework over a 30-day window; pattern detection, strategic shifts, monthly priorities
- Full: same 8 questions on a broader scope with extra competitive depth, generated on demand
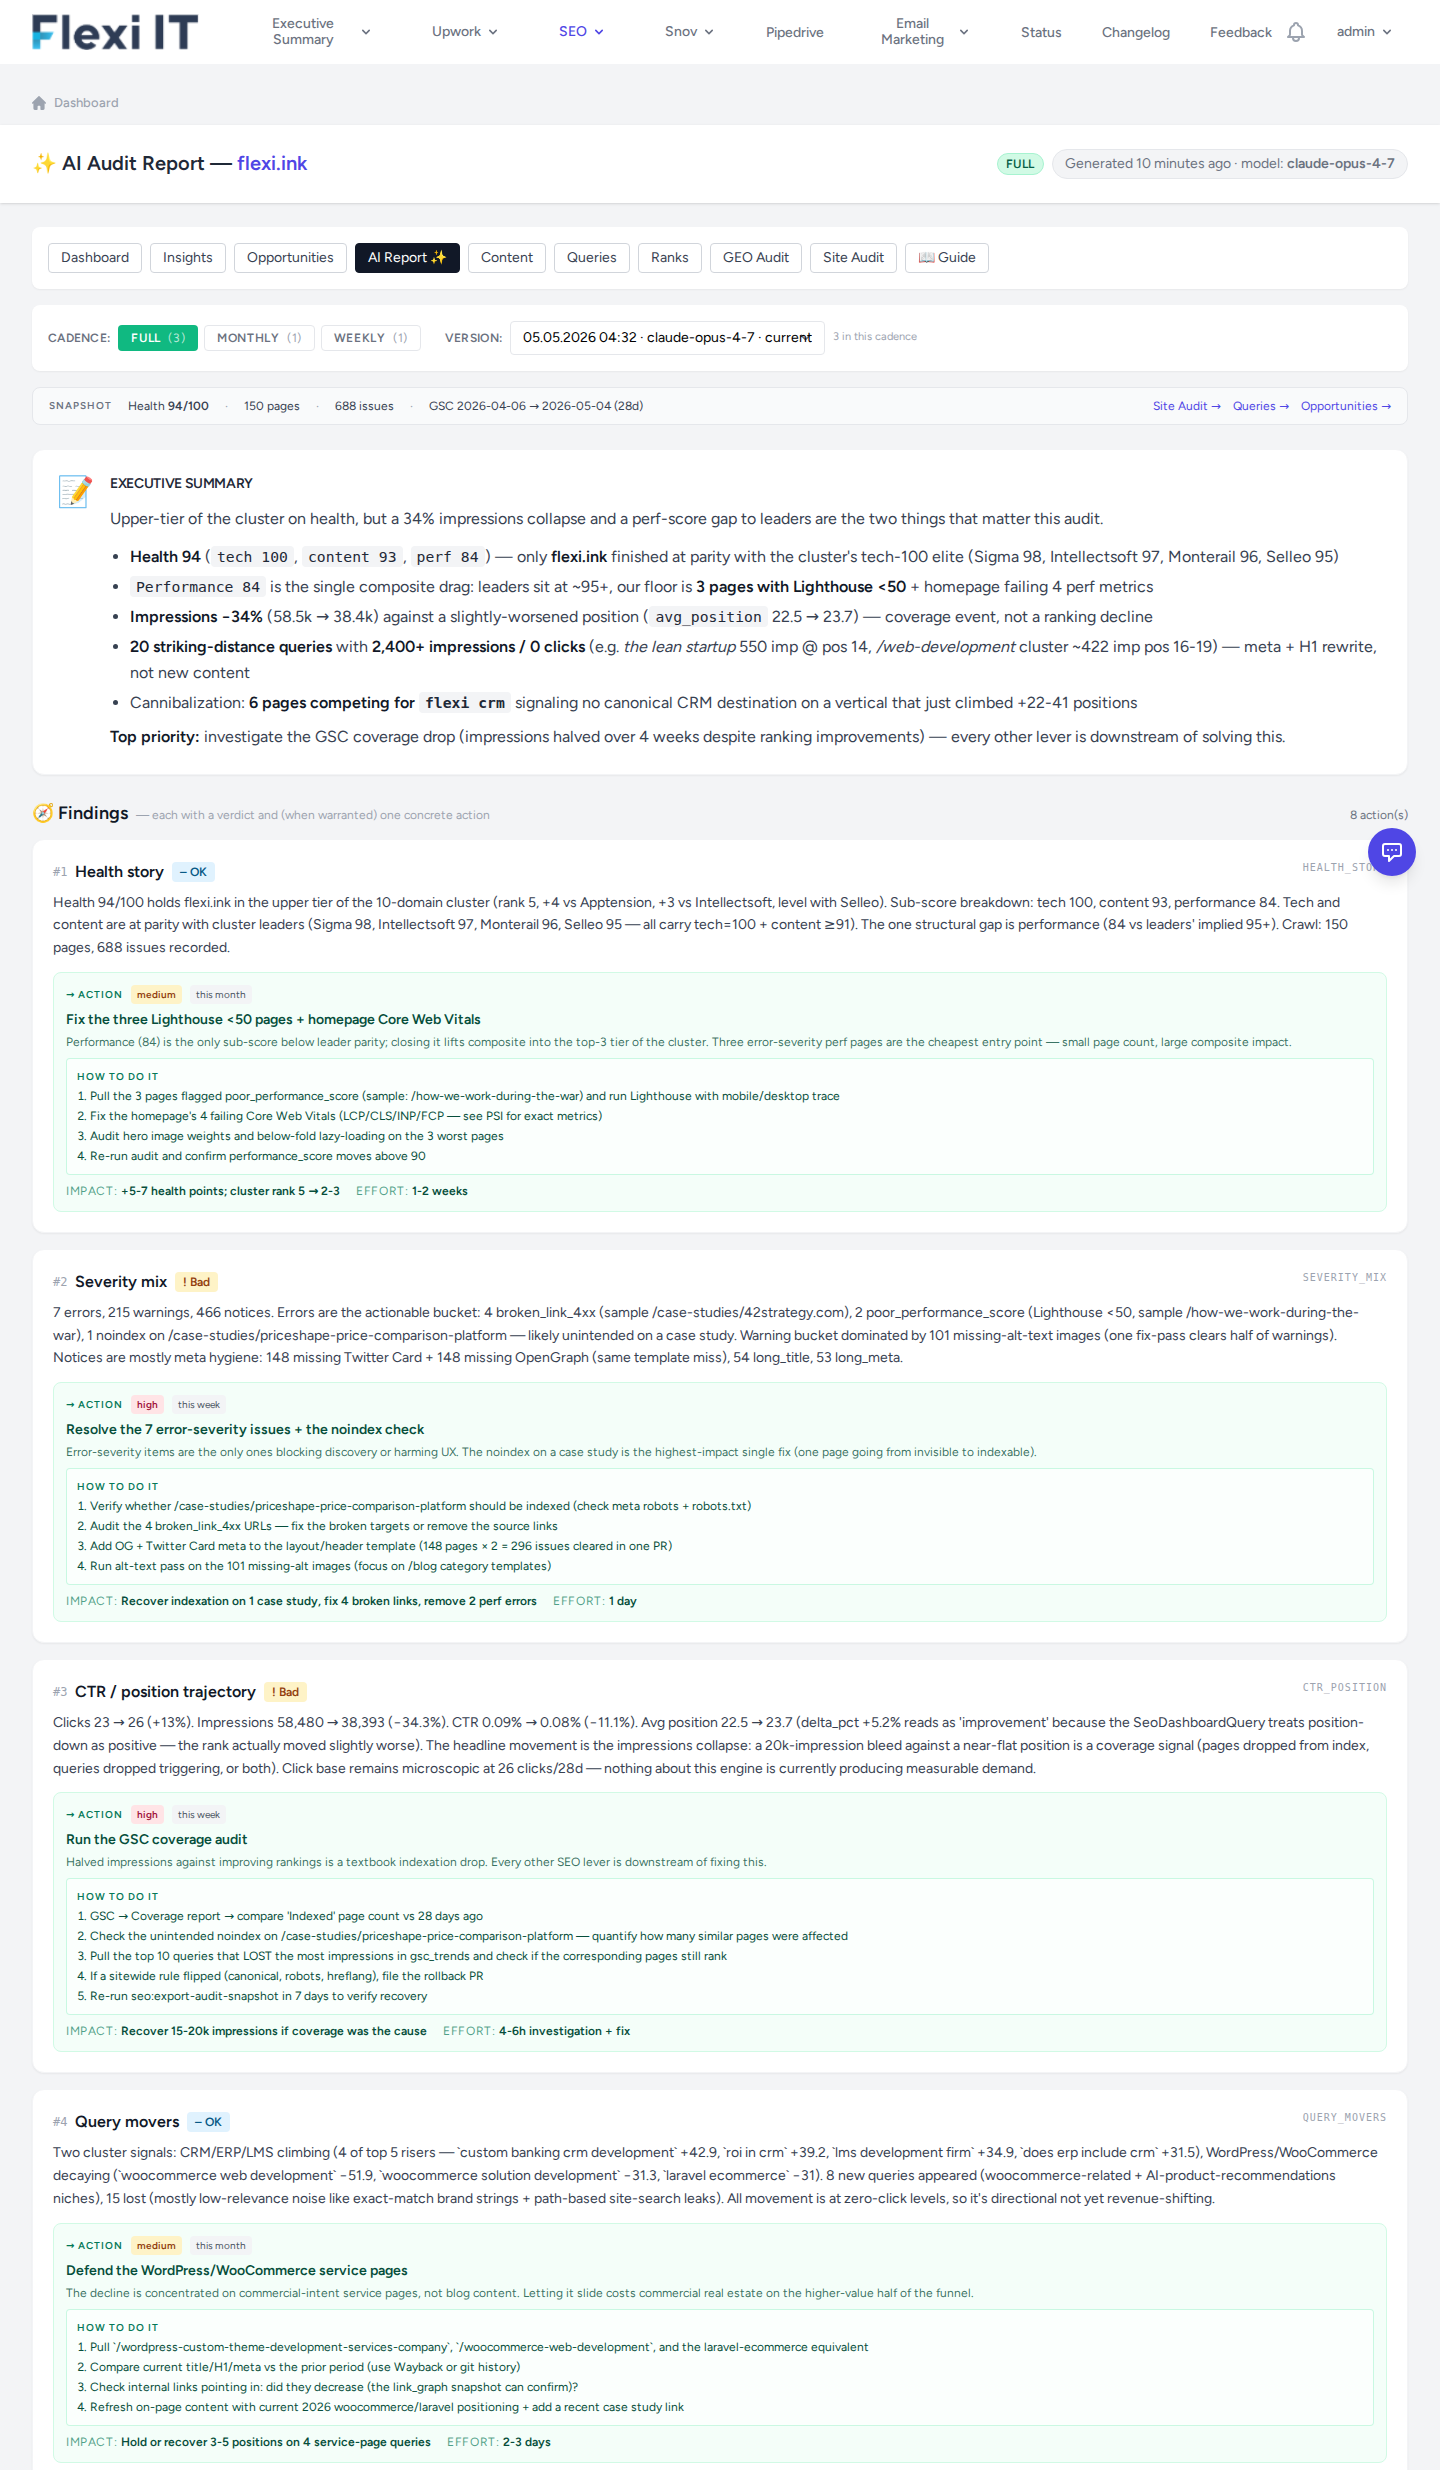
Reports surface both as full pages and as compact popups on the main dashboard. One click on a module card opens a focused brief.
Next on the roadmap: AI-recommended actions become assigned Jira tickets with owner, due date, and a back-link to the source finding — closing the loop from "what should we do" to "who's doing it by when".
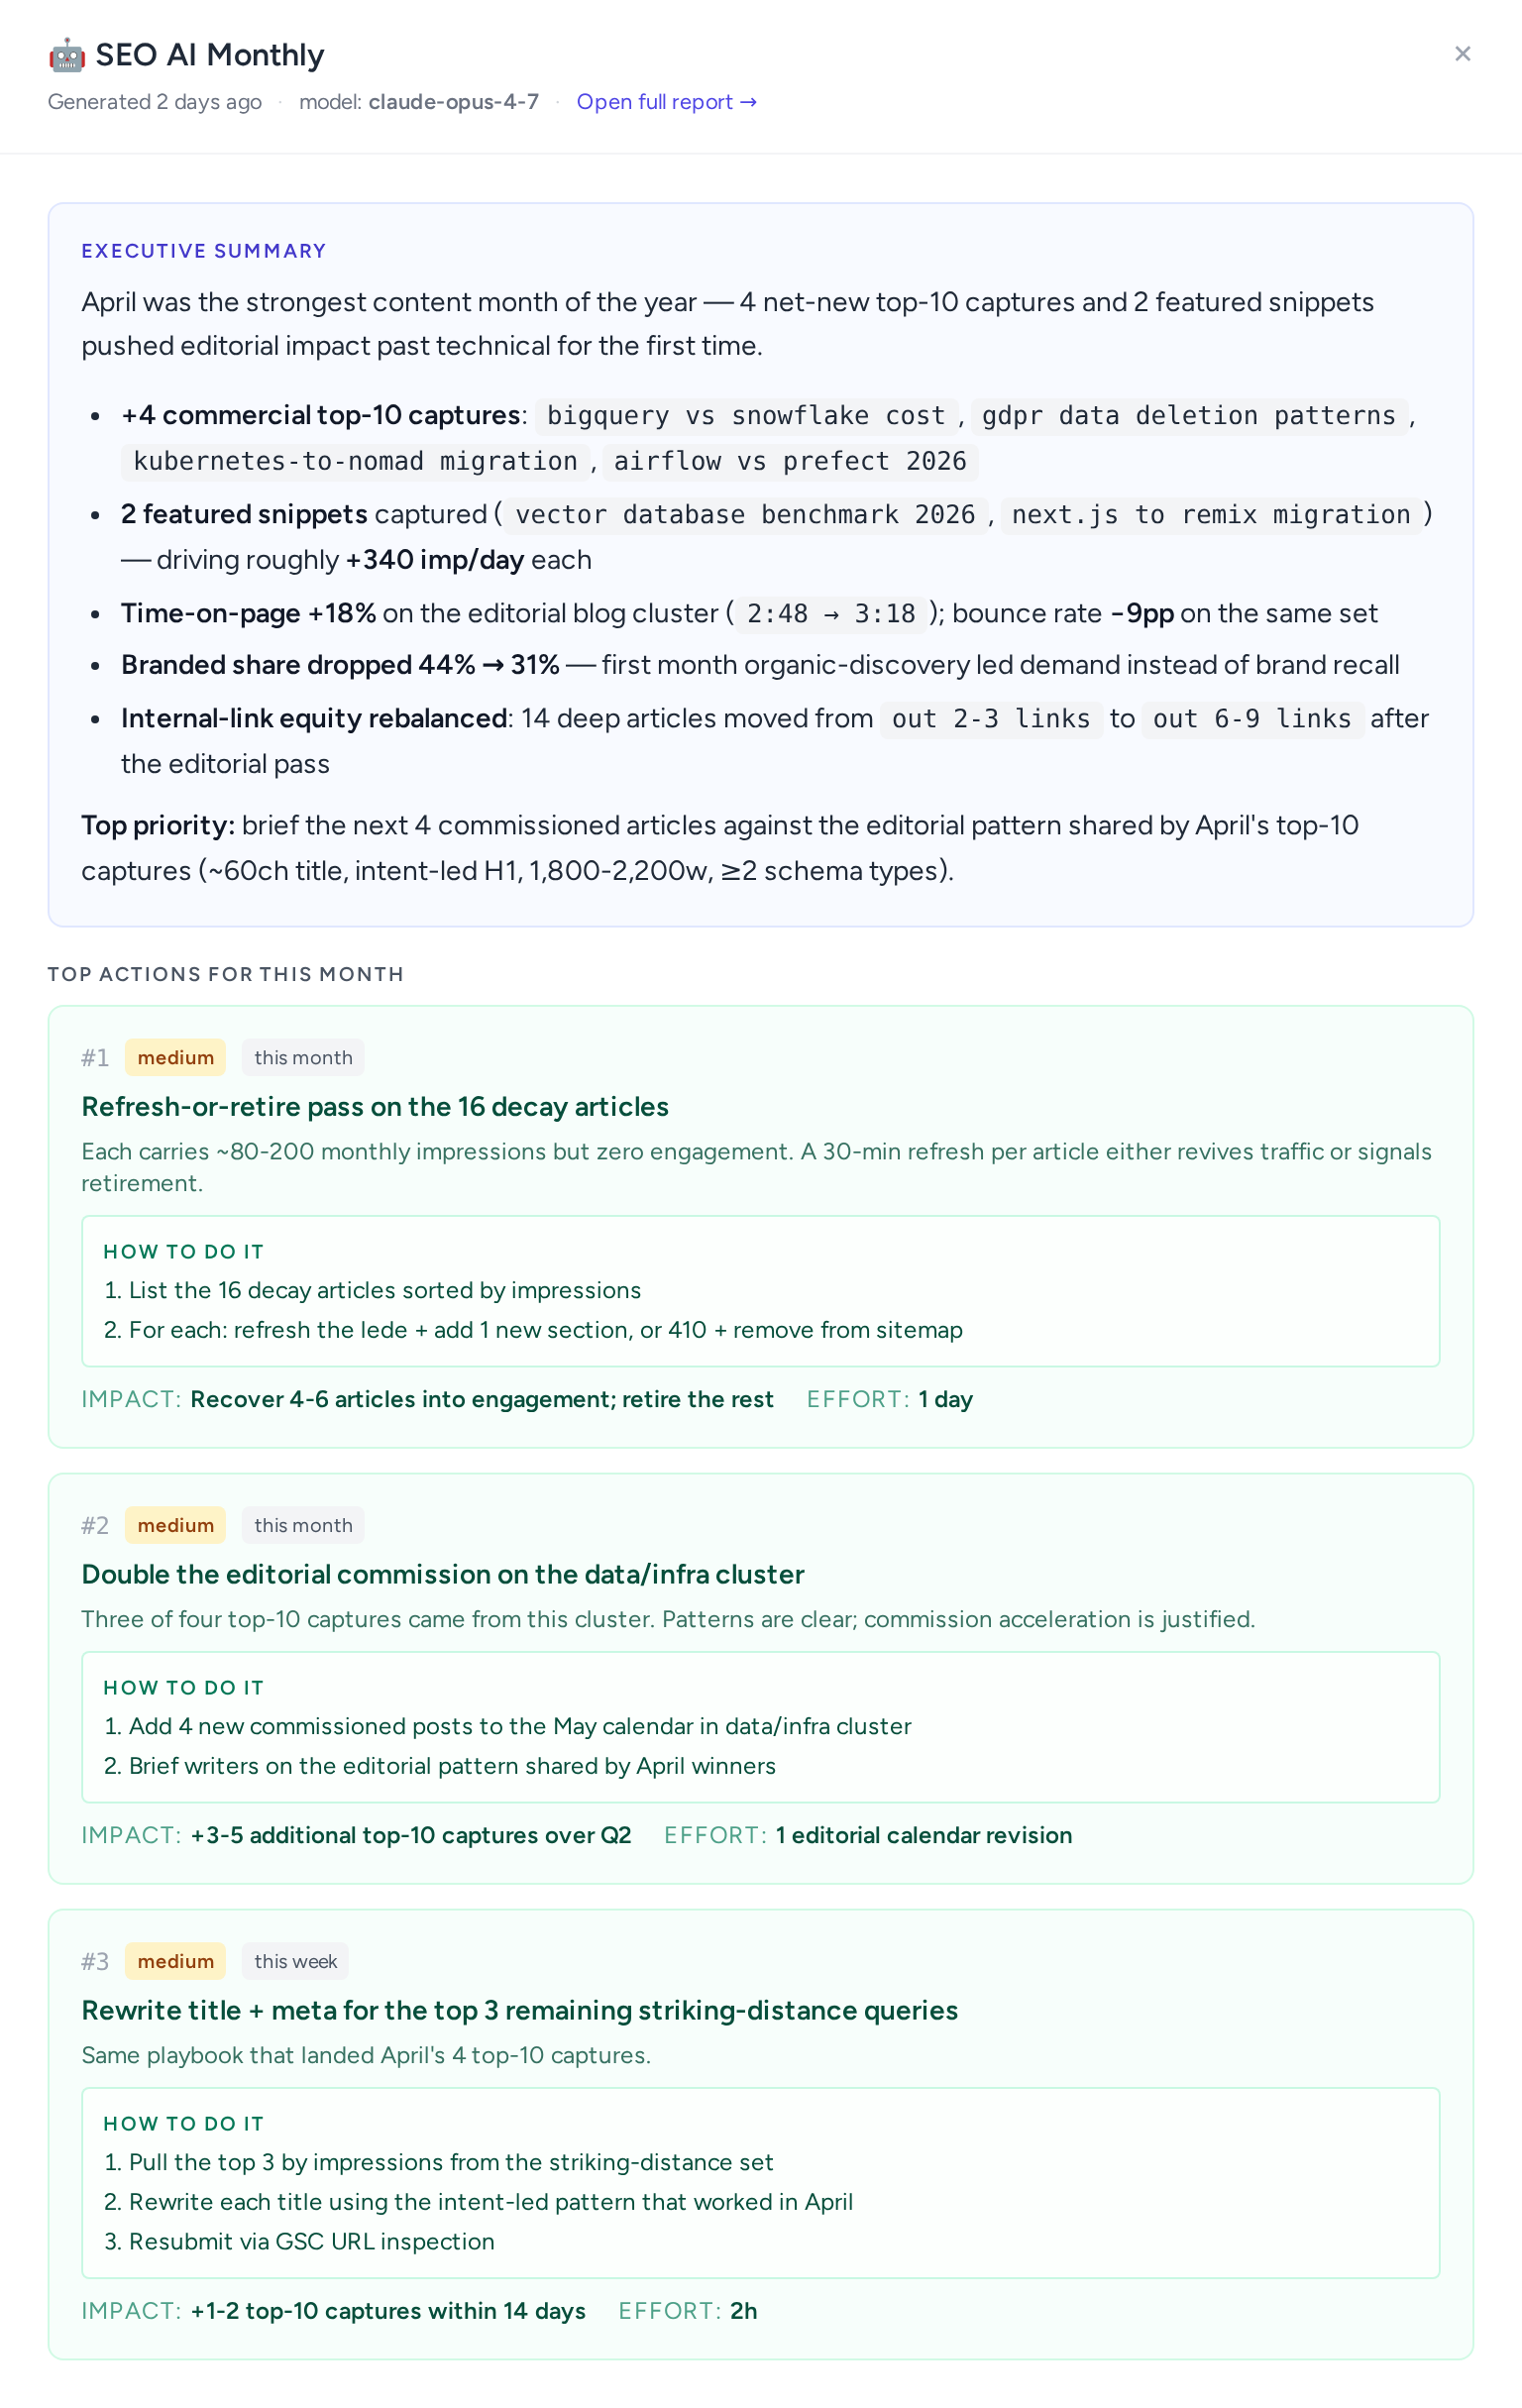
Periodic reports
We initially explored cross-channel weekly and monthly memos synthesising signals across the system. In practice, simplifying to per-module AI Audit Reports proved cleaner. Each domain has its own cadence and its own questions, and a single cross-channel layer would have flattened that.
For SEO, we additionally maintain a narrative-style periodic brief, better suited to its analytics-heavy nature than the structured Q&A format.
Replaces Google Docs that were previously assembled by hand each cycle
Self-healing queue infrastructure
A background-job platform with auto-recovery: stale-run detection, abandoned-batch reset, and automatic worker restart per site (in a multi-site setup, workers are isolated by project path).
Sync logs are persisted in the database, with per-job traceability and a dedicated HTTP audit endpoint (/email-marketing/api-logs).
Failures are surfaced immediately, before broken jobs silently corrupt downstream data.
Technologies
| Backend | PHP 8.2, Laravel 12, MySQL |
| Frontend | Blade, Alpine.js, ApexCharts, Tailwind CSS, Vite |
| AI | Anthropic Claude API |
| Integrations | Google Analytics 4, Google Search Console, Snov.io, Lobstr.io, Dropcontact, Pipedrive, Google PageSpeed Insights |
| Infrastructure | Laravel Queue, Supervisor, Nginx + PHP-FPM, Laravel Scheduler |
| Testing | PHPUnit |
Outcomes
| Review cycle compressed | what used to take a full quarter now happens in minutes, in a single interface |
| n8n workflows retired | the Lobstr → Snov → Dropcontact cascade now runs as native Laravel jobs with structured logs and auto-recovery |
| Multi-tenant from day one | the SEO Suite is architected to host multiple client projects, ready for white-label productisation |
| Productisation opportunity | several clients have already requested similar systems; the dashboard has become a sellable deliverable |
From tools to system: a unified decision-making layer instead of fragmented platforms.
What's next
| Bringing more systems into the dashboard | Hurma HR, our invoice system, and Slack, adding capacity, revenue, and operational signals into the same workspace |
| AI insight → Jira workflow | AI-recommended actions from the audit reports become assigned Jira tickets with owner, due date, and a back-link to the source finding — closing the loop from "what should we do" to "who's doing it by when" |
| Cross-source analytics + AI-engine visibility | joining signals across modules into a single owner-level view, plus tracking brand mentions in AI search (ChatGPT, Perplexity, Google AI Overviews, Claude, Gemini) — extending the existing GEO Audit from "is your site AI-ready" to "is your site actually being cited" |
| Conversational AI assistant | a chat interface that answers ad-hoc questions across every integration in plain language ("how many leads from Lobstr converted last quarter?", "which Upwork profile had the lowest hidden ratio in March?", "who's overdue on Acme's renewal?") — turning periodic audit reports into an on-demand interface |
| Productisation for agency clients | white-label PDF reports, branded client portals, project onboarding wizard, per-client API tokens |
The same AI-assisted, build-it-ourselves pattern is applied across other internal systems where off-the-shelf tools don't fully fit.
The dashboard started as an internal tool. We now operate it daily as the core system behind our marketing and sales — and several agency clients have already asked us to build them their own.
Try us for 14 days
Want to start a 2-week free trial period with us? Leave your email below and we'll revert to you shortly with more details